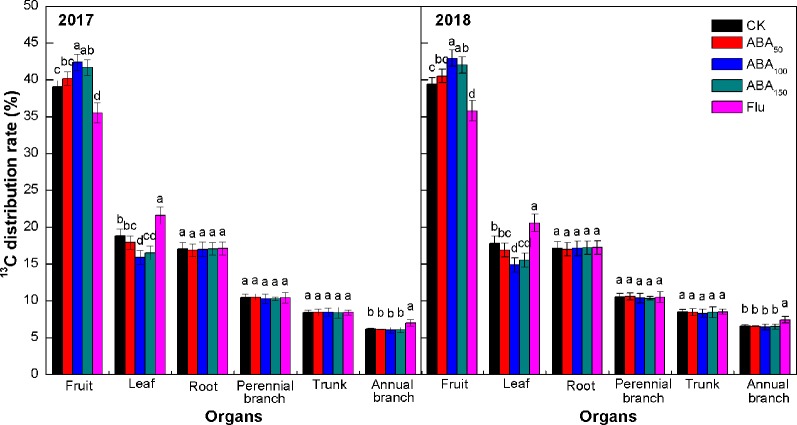
Figure 3.
Effects of different treatments on the 13C distribution rate at the fruit maturity stage in 2017 and 2018 (13C distribution rate refers to the ratio of the 13C content of each organ to the amount of net 13C absorbed by the plant). The vertical bar indicates the standard deviation of three replications. Different letters indicate statistically significant differences (P < 0.05).

