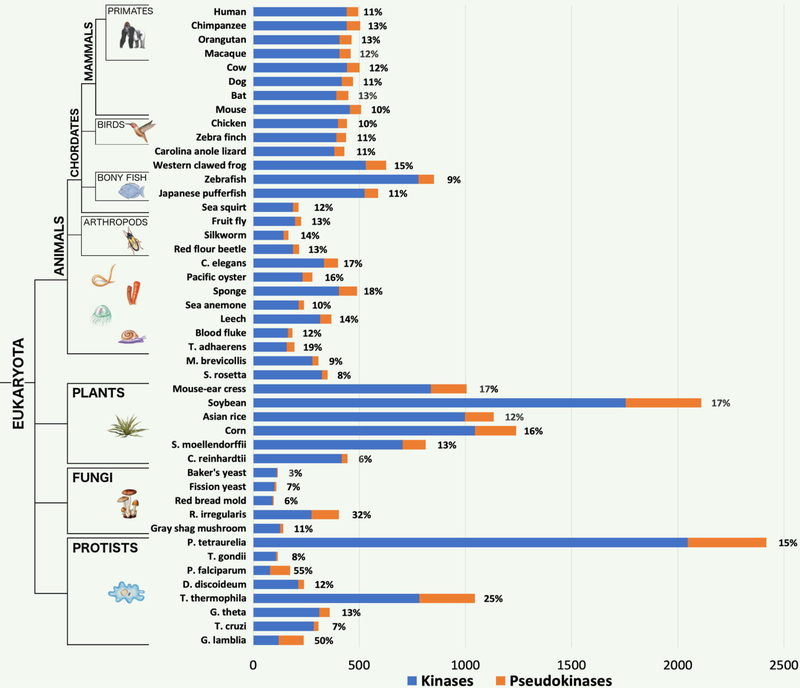
Fig. 1.
Kinome and pseudokinome sizes evaluated in 46 eukaryotic species. Blue bars represent the number of kinases detected in the proteome of each species, and orange bars represent the number of pseudokinases. Percentages indicate the fraction of kinases from each proteome that were determined to be pseudokinases. The tree on the left indicates major evolutionary kingdoms and phyla.

