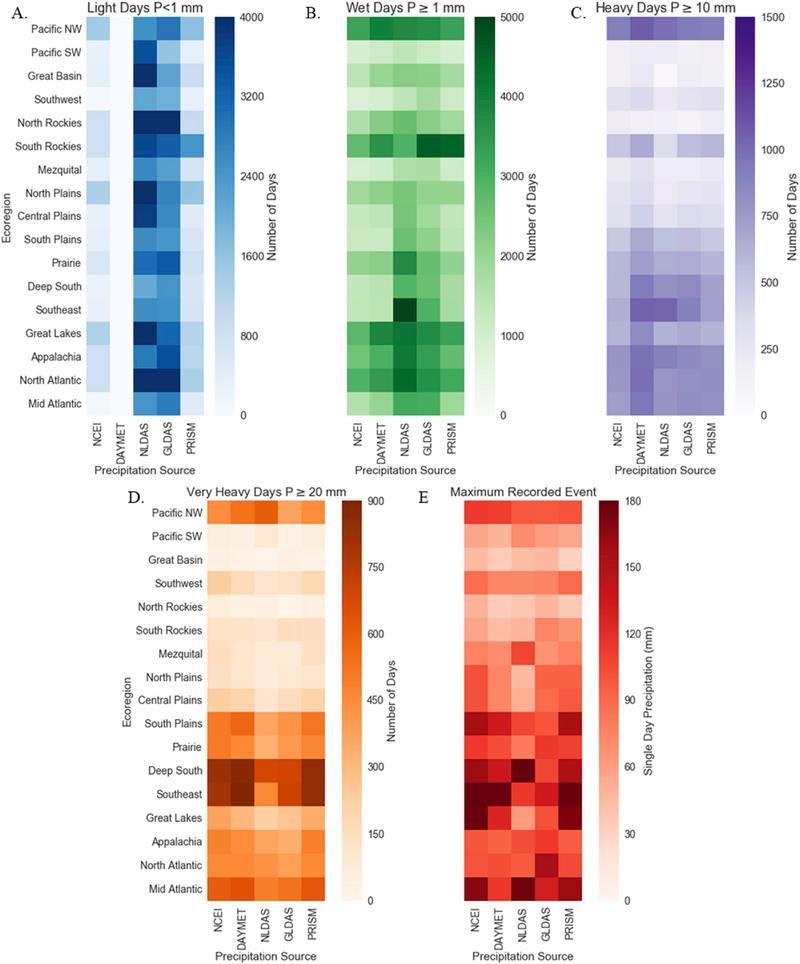
Fig. 7.
Data from HMS-PCAT were used to calculate the total number of days out of the 37-year (13,514 day) time frame for threshold values of precipitation (P). CLIMDEX threshold indices are categorized by precipitation as (A) light, P <1 mm; (B) wet, P ≥ 1 mm, (C) heavy, P > 10 mm, and (D) very heavy days, P > 20 mm. Single day maximum precipitation value recorded in mm is shown in panel E.

