Figure 1.
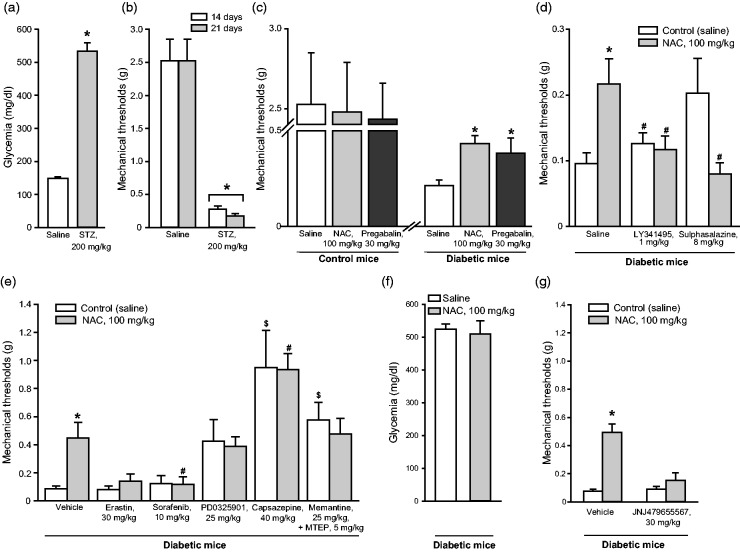
NAC-induced analgesia in the STZ model of painful diabetic neuropathy. Blood glucose levels in mice receiving a single injection of saline or STZ (200 mg/kg, i.p.) are shown in (a), where values are means ± S.E.M. of 7–10 mice. *p < 0.05 (Student’s t-test; t = −8.279). Reductions of mechanical pain thresholds in the same mice at 14 and 21 days following STZ injection are shown in (b), where values are also means ± S.E.M. *p < 0.05 (one-way ANOVA for repeated measures + Duncan method; F(1,13) = 77.224). The effect of a single injection of NAC or pregabalin on mechanical pain thresholds in diabetic mice and non-diabetic control mice are shown in (c), where values are means ± S.E.M. of 7–10 mice. *p < 0.05 (one-way ANOVA + Duncan method applied only to the groups of diabetic mice; F(2,18) = 4.562). The effect of repeated administrations of saline or NAC (100 mg/kg, i.p., once a day for 7 days starting from 21 days after STZ injection) on mechanical pain thresholds are shown in (d and e). In (d), all groups of mice were injected once with saline, LY341495, or sulfasalazine at the end of the chronic treatment with saline or NAC (see Methods). Values are means ± S.E.M. of 6–7 mice per group. p < 0.05 versus the control group receiving repeated injections of saline followed by a single injection of saline (*); or versus the group treated with NAC and a single injection of saline (#) (one-way ANOVA + Duncan method; F(5,35) = 3.364). In (e), all groups of mice were injected once with vehicle, erastin, sorafenib, PD0325901, capsazepine, and mementine+MTEP at the end of the chronic treatment with saline or NAC. Values are means ± S.E.M. of 4–10 mice per group. p < 0.05 versus the control group receiving repeated injections of saline followed by a single injection of vehicle (*); or versus the group treated with NAC and a single injection of vehicle (#); or versus the control group receiving repeated injections of saline followed by a single injection of vehicle ($) (one-way ANOVA + Duncan method; F(11,73) = 7.947). Blood glucose levels in mice receiving a single injection of saline or NAC (100 mg/kg, i.p.) are shown in (f), where values are means ± S.E.M. of 9 mice. In (g), four groups of mice were injected once with vehicle or JNJ47965567 (30 mg/kg) at the end of the chronic treatment with saline or NAC. Values are means ± S.E.M. of 7–10 mice per group. p < 0.05 versus all other groups (one-way ANOVA + Duncan method; F(3,28) = 18.643). NAC: N-acetylcysteine; STZ: streptozotocin.

