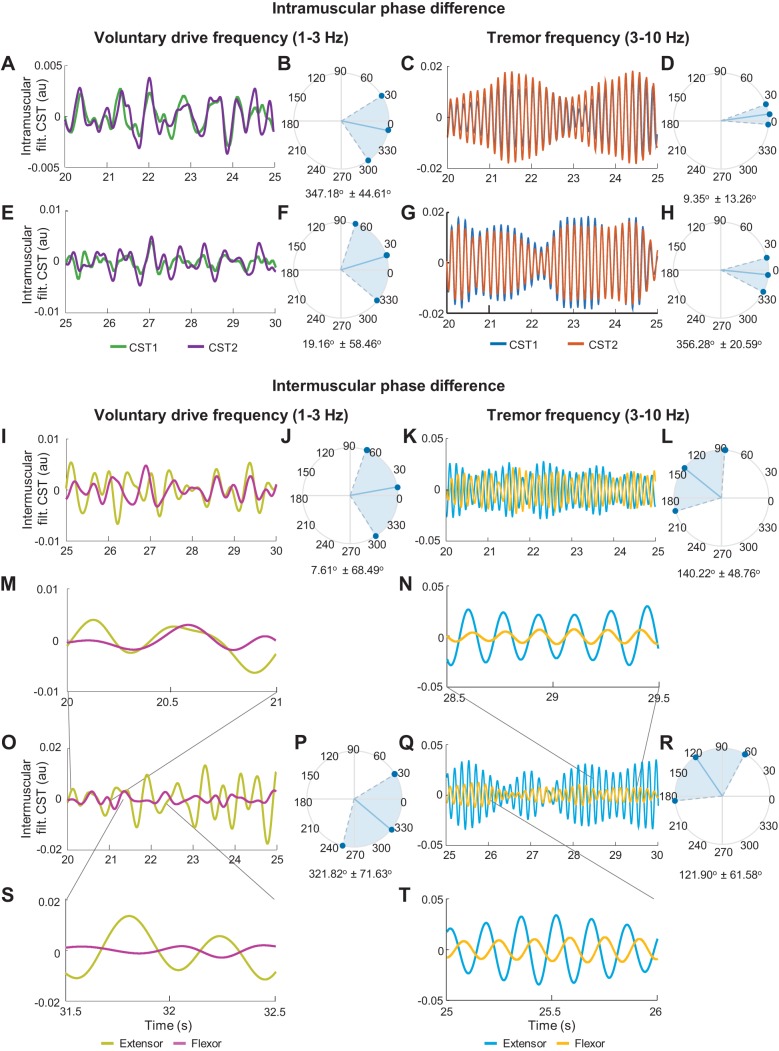
Fig. 4.
Representative phase difference between the neural drive to agonist muscles (A–H) and antagonist muscles (I–T) at the voluntary drive and tremor frequencies of a patient. A–H: phase difference between neural drive to extensor (A, C) and flexor (E, G) muscles of the left wrist. The phase differences were compared using the filtered cumulative spike trains [filt. CST; groups of half the maximum number of motor units (MUs)] at the voluntary drive frequency (1–3 Hz) and the tremor frequency (±1 Hz with respect to the dominant tremor frequency). B, D, F, and H: circular histograms of the intramuscular phase difference showing relatively in-phase patterns of the MU activations in both frequency ranges. I–T: phase difference between the neural drive to antagonist muscles of the left (I, K) and right (O, Q) wrists and their circular histograms (J, L, P, R). The average (over time) intermuscular phase difference at the voluntary drive frequency was relatively in phase (I, O), whereas that at the tremor frequency was relatively out of phase (K, Q). As shown by this representative patient data, the phase difference varied over time from in-phase to out-of-phase patterns in both frequencies (M, N, S, T). au, Arbitrary units.

