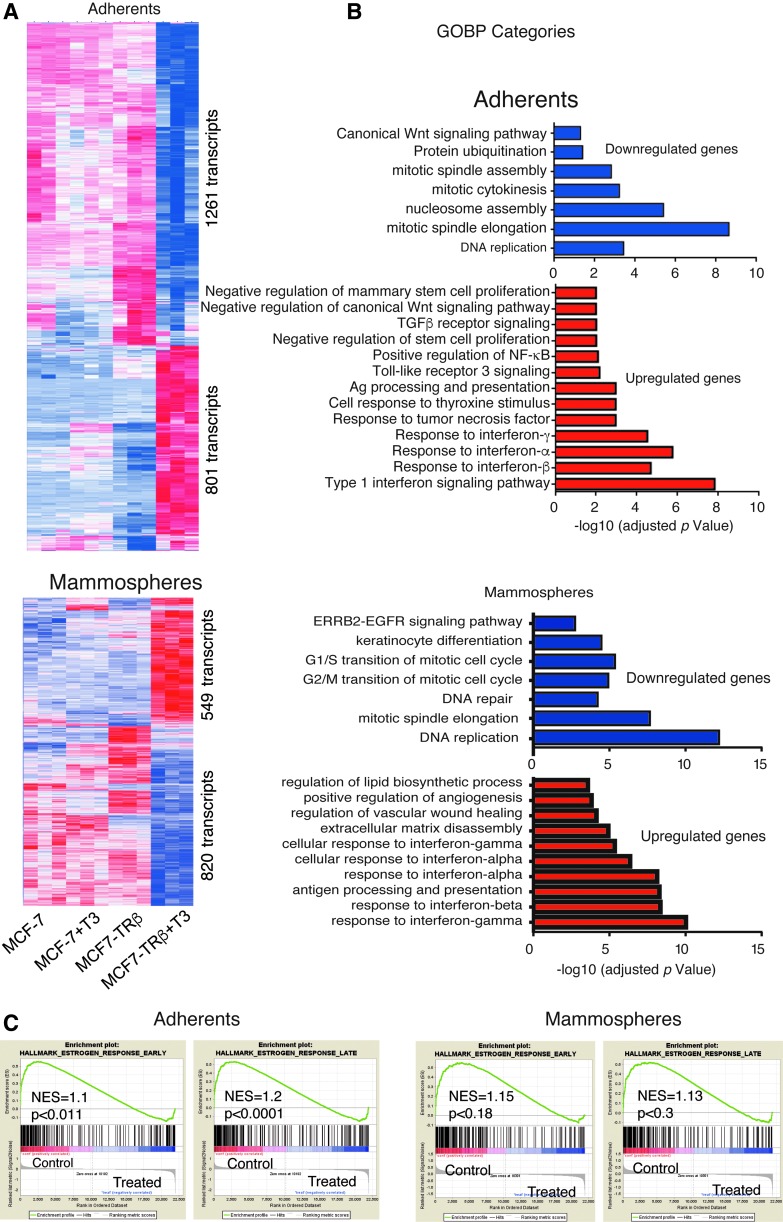
FIG. 5.
Transcriptional profiling of adherent cells and mammospheres. (A) Heatmap showing differential gene expression between adherent MCF7 and MCF7-TRβ cells untreated and treated with T3 for 10 days (upper panel). Heatmap obtained in untreated and treated seven-day secondary mammospheres obtained from three-day primary mammospheres (lower panel). The number of transcripts downregulated and upregulated by T3 in MCF7-TRβ cells is indicated. (B) Top overrepresented GOBP categories with significant reduction (upper panel) or enrichment (lower panel) based in adjusted p-values in the T3-treated with respect to the untreated MCF7-TRβ cells, grown as adherent cultures or mammospheres. (C) Enrichment plots from GSEA showing the downregulation of Hallmark Estrogen Response Early and Late gene sets in T3-treated MCF7-TRβ cells. GOBP, Gene Ontology of Biological Process; GSEA, gene set enrichment analysis.

