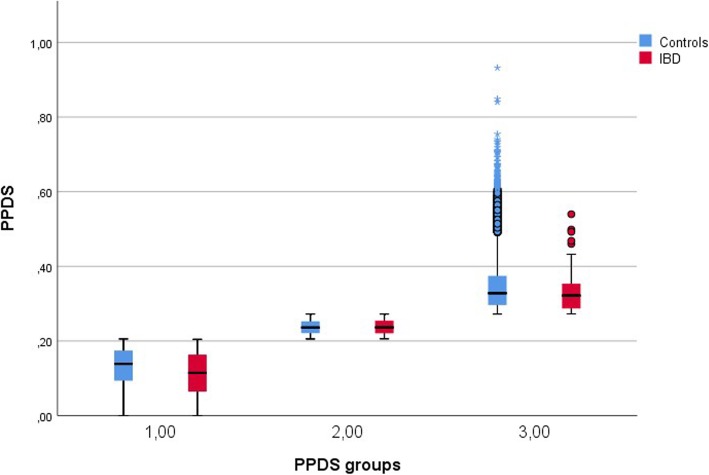
Fig. 2.
Difference in proportion of protein from dairy sources (PPDS) between IBD and non-IBD, by PPDS-groups. Legend: The boxplots compare the distribution of PPDS between IBD and non-IBD mothers in each PPDS groups. The difference in PPDS between IBD and non-IBD mothers is significant only in the lowest PPDS group

