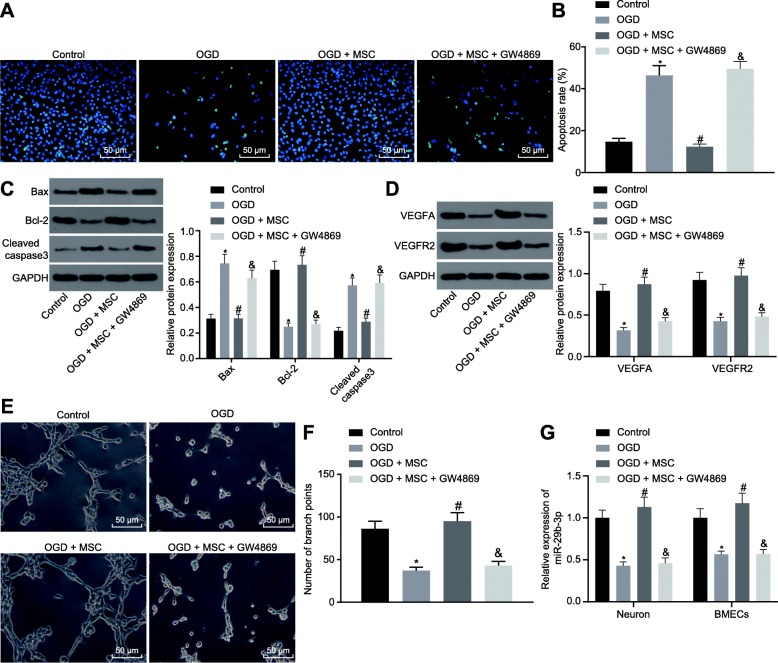
Fig. 2.
BMSCs reduce the neuron apoptosis and inhibit angiogenesis of BMECs exposed to OGD by releasing exosomes. TUNEL staining (a) and the quantification (b) of apoptosis in cortical neurons (scale bar = 50 μm). c, d The protein expression and quantification of neuronal apoptosis- and angiogenesis-related proteins analyzed by western blot analysis. e, f Representative images and quantification of tube formation ability of BMECs (scale bar = 100 μm). g The expression of miR-29b-3p detected by RT-qPCR in cortical neurons and BMECs. *p < 0.05 vs. the control group. #p < 0.05 vs. the OGD + MSC group. The measurement data are expressed in the form of mean ± standard deviation. The comparison between the two groups was carried out by the independent sample t test. The experiment was repeated three times

