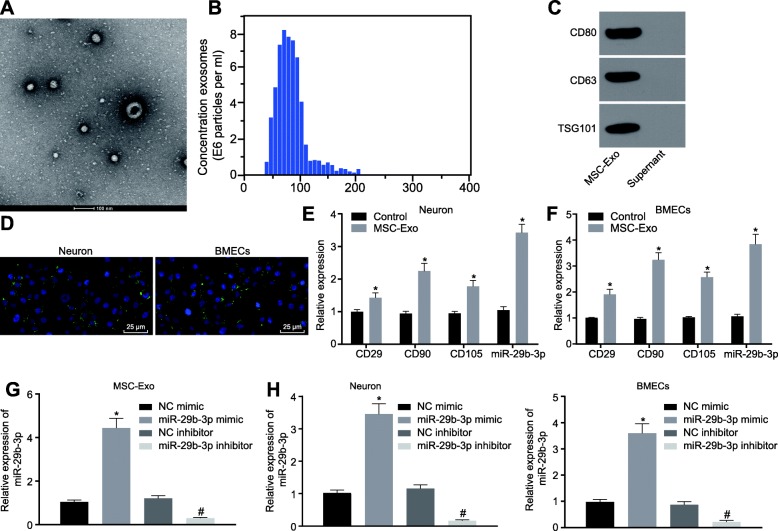
Fig. 3.
The exosomes derived from BMSCs carry miR-29b-3p. a Morphologic observation of the exosomes under a transmission electron microscopy (scale bar = 200 nm). b Particle size distribution measured by DLS. c The protein expression of TSG101, CD80 and CD63 in exosomes from BMSCs detected by western blot analysis. d The PHK-67-labeled exosomes in neurons and BMECs observed under a fluorescence microscope (scale bar = 50 μm). e, f The expression of BMSCs marker proteins and miR-29b-3p in neurons and BMECs treated with BMSCs-secreted exosomes detected by RT-qPCR. g, h The expression of miR-29b-3p in neurons and BMECs treated with BMSCs-secreted exosomes containing miR-29b-3p mimic or inhibitor, as detected by RT-qPCR. *p < 0.05 vs. the control group or the OGD group, #p < 0.05 vs. the OGD + BMSCs group. The measurement data are expressed in the form of mean ± standard deviation. The comparison between the two groups was carried out by the independent sample t test. Comparison among multiple groups was conducted using one-way analysis of variance, followed by Tukey’s post hoc test. The experiment was repeated three times

