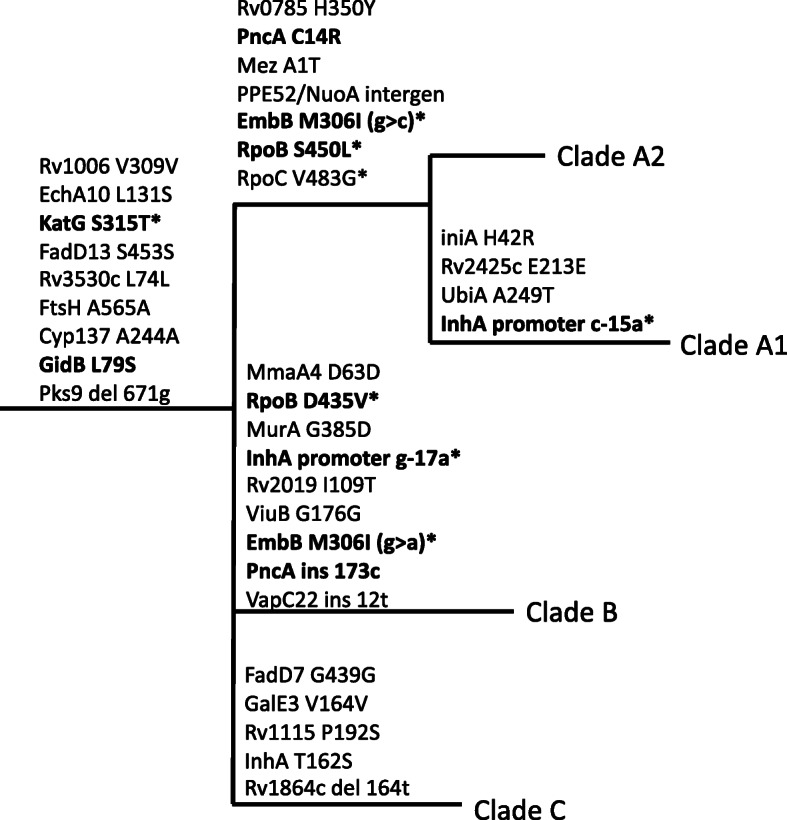
Fig. 2.

Schematic representation of variants defining the AA1SA subclades A–C, not drawn to scale. Variants indicated in boldface are associated with drug resistance. Variants labelled with an asterisk (*) also occur outside of these branches, but not necessarily elsewhere in the phylogeny shown in Fig. 1
