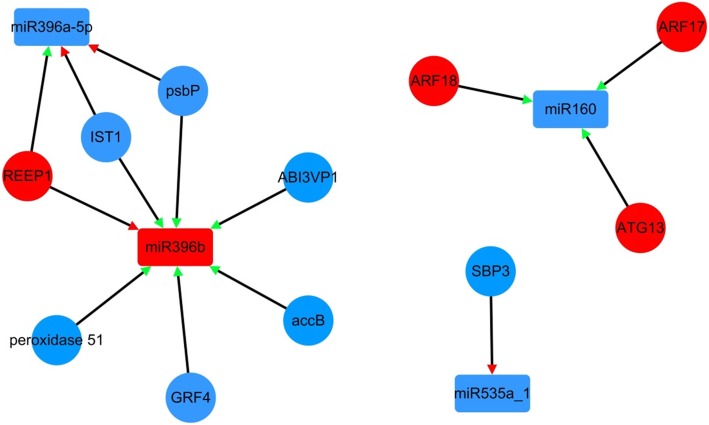
Fig. 6.
Regulatory network from the integrated analysis of miRNA-mRNA data. Co-expressed miRNA-mRNA interactions visualized as a network using Cytoscape. Triangle represents the expression type of miRNA (red triangle represents positive correlation, green triangle represents negative correlation in each miRNA-mRNA), red represents up-regulation and blue represents down-regulation in network, the circle represents mRNA, the rectangle represents miRNA

