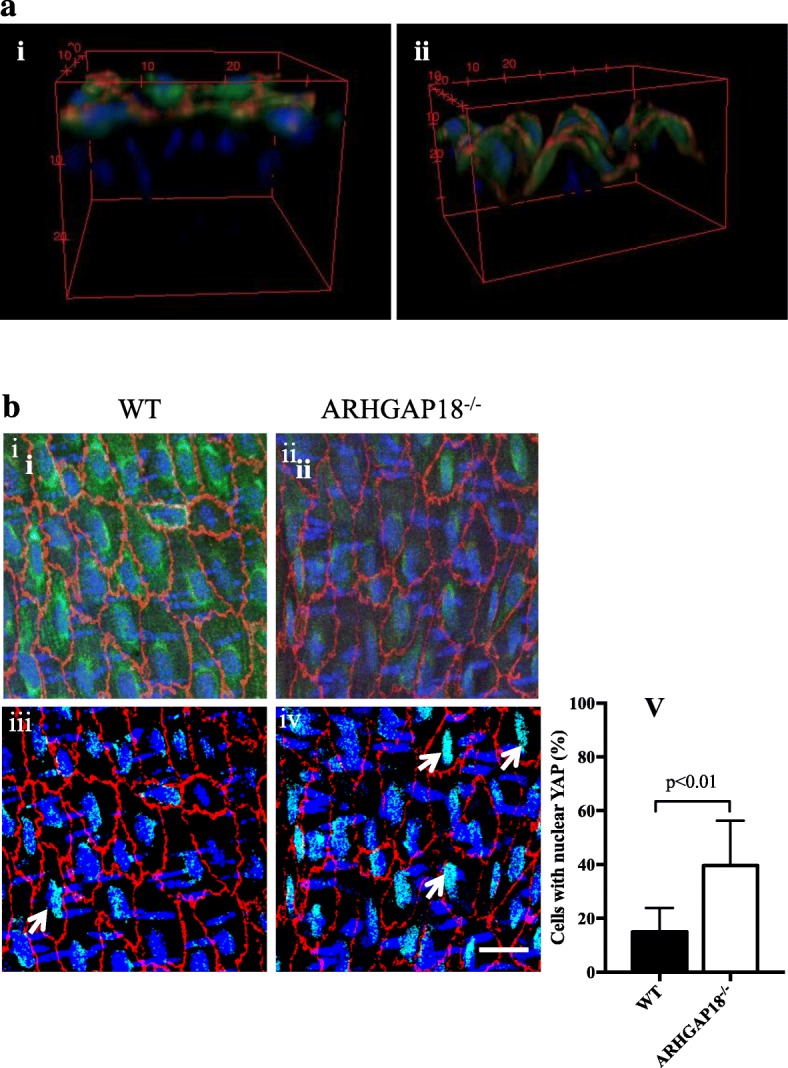
Fig. 6.

YAP is localised in the nucleus in areas of disturbed flow in ARHGAP18−/− mice. a 3D reconstructed images of the endothelium side view of aortic arch (i) and thoracic aorta (ii), showing YAP expression (green) exclusively on the VE-Cadherin positive EC layer (red), nuclei (DAPI, blue). b YAP expression levels in ECs in the thoracic aorta regions in WT (i, iii) and ARHGAP18−/− mice (ii, iv). The processed binary images (iii, iv) taken from WT and ARHGAP18−/− after cytoplasmic YAP exclusion (as given in the M&M) shows increased nuclear localisation in the ARHGAP18−/− (white arrows). Images are representative of 6 independent experiments performed. Scale bar = 20 μm. v Percentage of cells with nuclear localised YAP, mean +/− SD, n = 6 mice
