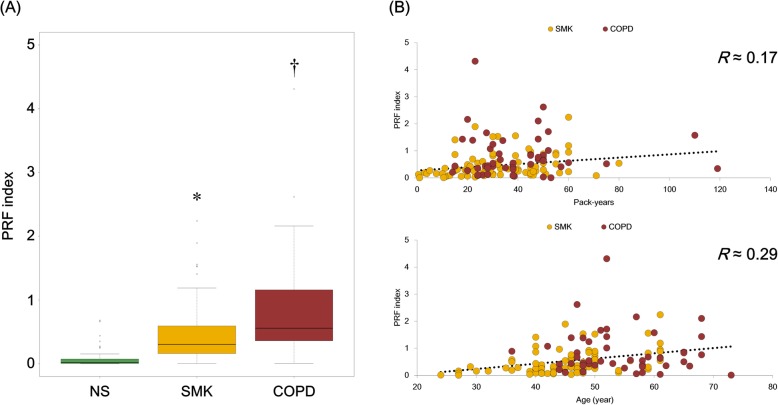
Fig. 4.
Potential risk factor calculation with publicly samples. a The box plot showing the potential risk factor (PRF) indices of non-smokers (green), smokers (yellow), and chronic obstructive pulmonary disease (COPD) subjects (red) in publicly available samples. The box plot presents the median (line) and 25th and 75th percentiles (box); the whiskers are the 5th and 95th percentiles; and the outliers are denoted by open circles. One-way ANOVA with subsequent Tukey’s honest significant difference post-hoc analysis revealed differences between NS and SMK (*p < 0.05) and between SMK and COPD (†p < 0.05). b The correlations of the PRF indices with pack-years and age in smokers and COPD subjects. The Pearson correlation coefficient (R) is shown in upper right of each image. NS, non-smokers; SMK, smokers; COPD, COPD subjects

