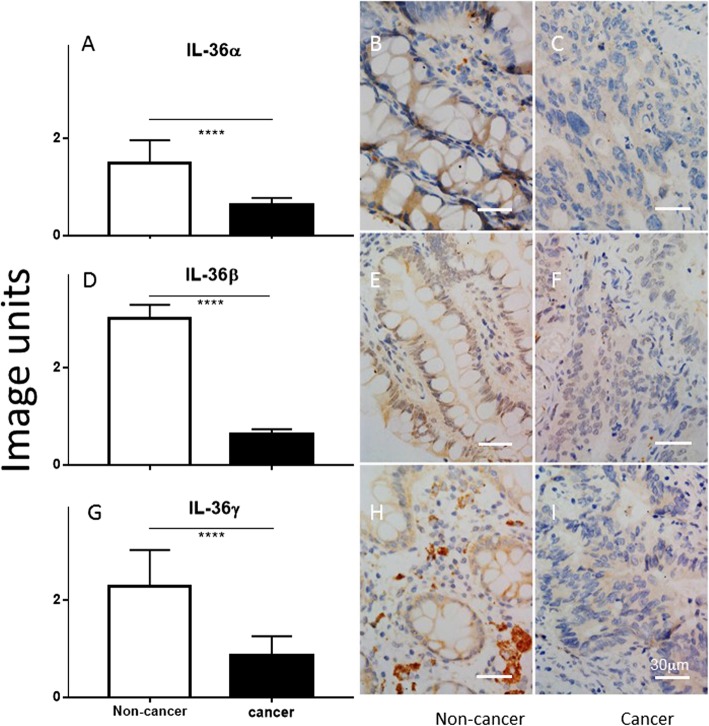
Fig. 1.
Comparison of the production of IL-36α, IL-36β and IL-36γ between non-cancer colon tissue versus cancer tissue in CRC (a, d and g, respectively), using Wilcoxon signed-rank test. Y-axis represents arbitrary image units. Representative images of IL-36α, IL-36β and IL-36γ production are illustrated in the microphotographs for non-cancer (b, e, and h) and cancer tissues (c f and i). ****: P < 0.0001. The bar represents 30 μm

