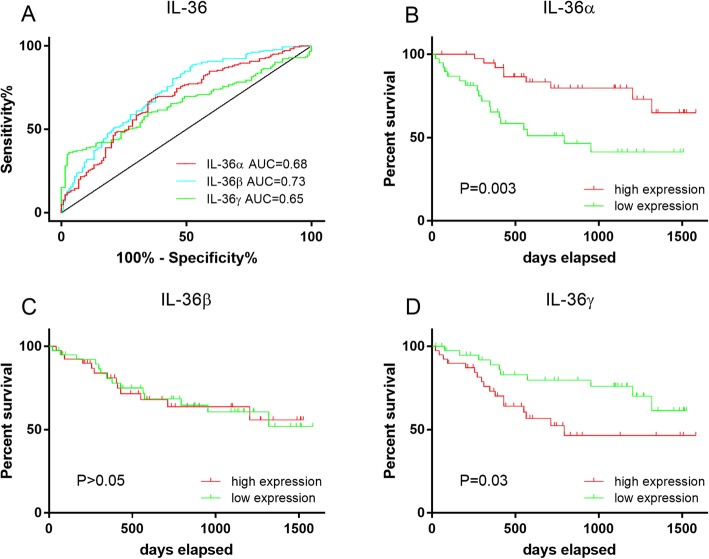
Fig. 2.
The ROC curve and survival curve analysis of the production of IL-36α, IL-36β and IL-36γ among the CRC patients. The specificity versus sensitivity of IL-36α, IL-36β and IL-36γ (a) in CRC is shown using ROC curves (a). Area under the curve, IL-36α: AUC = 0.68; IL-36β: AUC = 0.73; IL-36γ: AUC = 0.65. Survival curves comparing high and low levels of production of IL-36α (b), IL-36β (c) and IL-36γ (d) are shown, using the Kaplan-Meier method and the log-rank test

