Fig. 2.
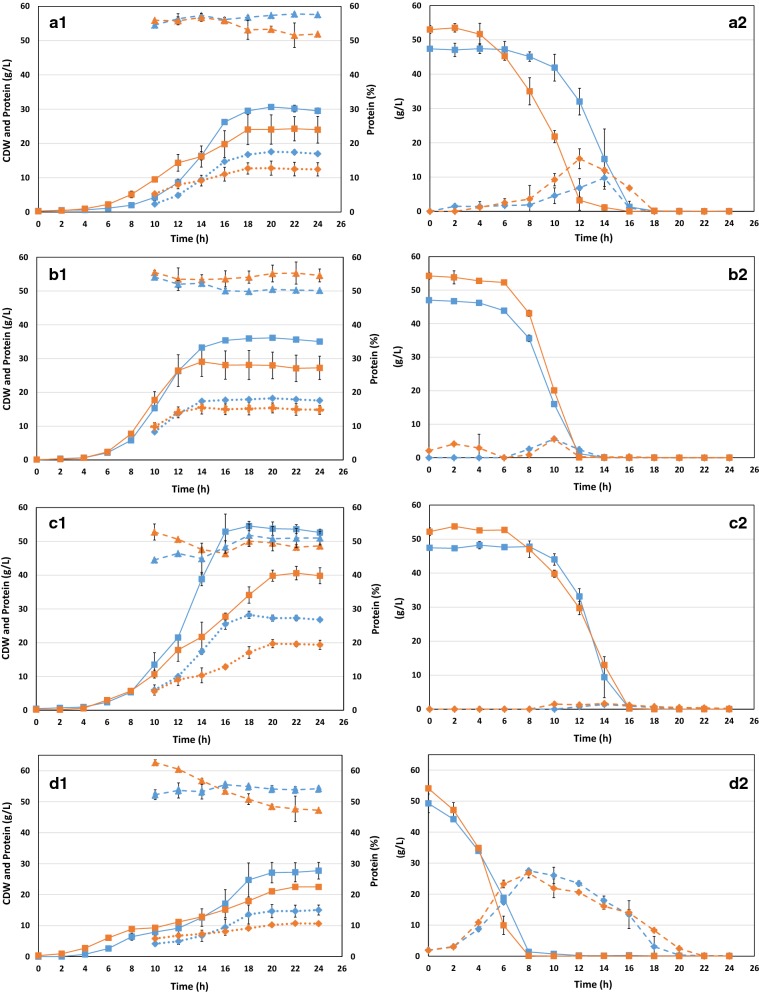
Batch cultivation of four yeast strains on YP + G (orange curves) or CH + B (blue curves) in a 2.5 L benchtop fermenter. The starting volume was 1.5 L and the fermentation lasted 24 h. Panels labeled 1 show accumulation of cells (square symbols, solid lines) and protein (diamond symbols, dotted lines), as well as the protein content of the cells (triangle symbols, dashed lines); panels labeled 2 show glucose (square symbols, solid lines) and ethanol (diamond symbol, dashed lines). aC. jadinii; bW. anomalus; cB. adeninivorans; d Thermosacc® Dry. Growth was monitored by measuring the CDW (g/L, square symbols, solid lines) every 2 h. For the samples taken from 10 h and onwards, the protein content (triangle symbol, dashed lines) of the dried cells was measured using the Kjeldahl method (w/w %). The concentration of yeast protein (g/L; diamond symbols, dotted lines) was calculated by multiplying CDW (g/L; square symbols, solid lines) with the protein content (w/w %). Acetic acid and lactic acid production were negligible for all yeasts on both media (results not shown). Values are mean ± SD (n = 2)

