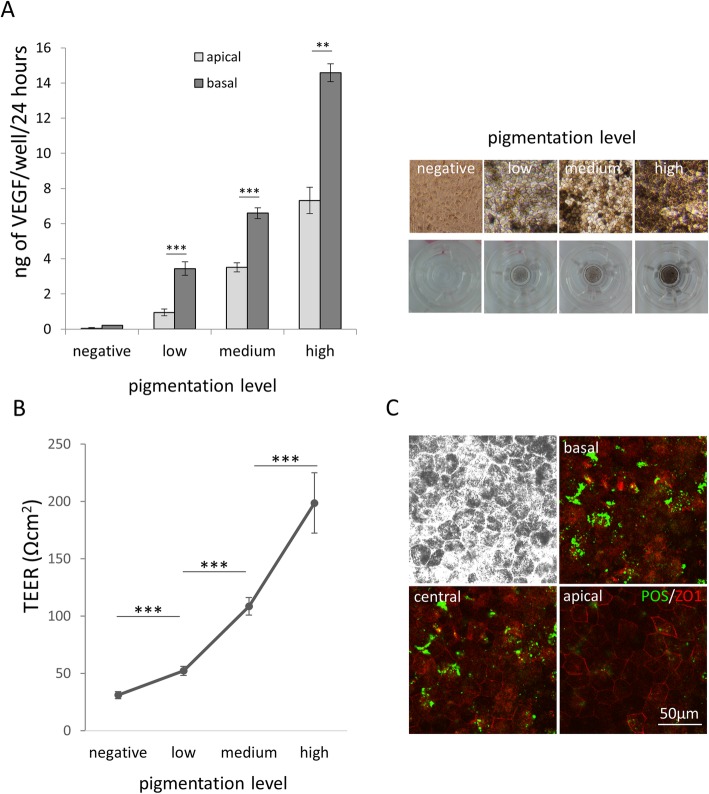
Fig. 3.
Functional assessment of hiPSC-RPE cell sheets in vitro. a ELISA of VEGF secretion by hESC-RPE (H1) on the apical and basal side of a 6.5-mm transwell membrane over a period of 24 h (VEGF: negative apical 0.05 ± 0.04, negative basal 0.21 ± 0.01, low apical 0.95 ± 0.19, low basal 3.44 ± 0.38, medium apical 3.51 ± 0.26, medium basal 6.59 ± 0.26, high basal 7.31 ± 0.74, high basal 14.58 ± 0.51 ng/well/24 h) (n = 5). Right panels show images of hESC-RPE exhibiting different grades of pigmentation as reference. b TEER of hESC sheets on transwell membranes during RPE differentiation (n = 5). c Confocal images taken at different depths (z-stack) of RPE cells challenged with FITC-conjugated rat POS for 6 h. Brightfield (upper left) and fluorescence images at different focal planes (basal, central, apical) show internalization of POS (green) in the cytoplasm of RPE cells. ZO1 staining (red) identify tight junctions expressed on the apical side. All pooled data are represented as mean ± SEM; *p < 0.05, **p < 0.01, ***p < 0.001 [Student t test]

