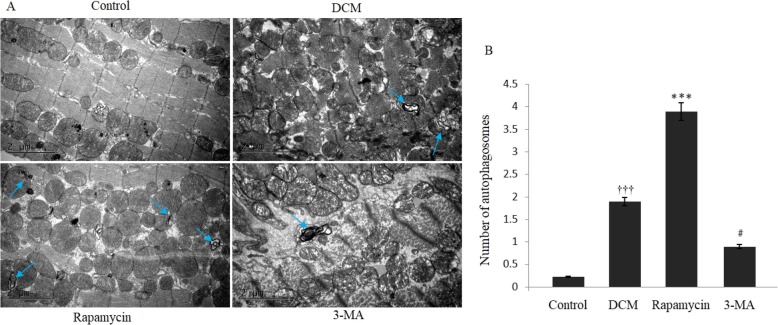
Fig. 2.
Transmission electron microscopy assessment for modulating autophagy. (A) Transmission electron microscopy indicated significant changes of autophagosomes in the four different groups. (B) Transmission electron microscopy showed that there was a significant increase of autophagosomes in the DCM group compared with the control group. Quantitative assessment demonstrated that autophagosomes were significantly increased in the rapamycin group, and they were decreased in the 3-MA group compared with the DCM group. †††P < 0.001 vs Control, ***P < 0.01 and #P < 0.05 vs DCM. The arrows indicated the double membrane autophagosomes in the different groups

