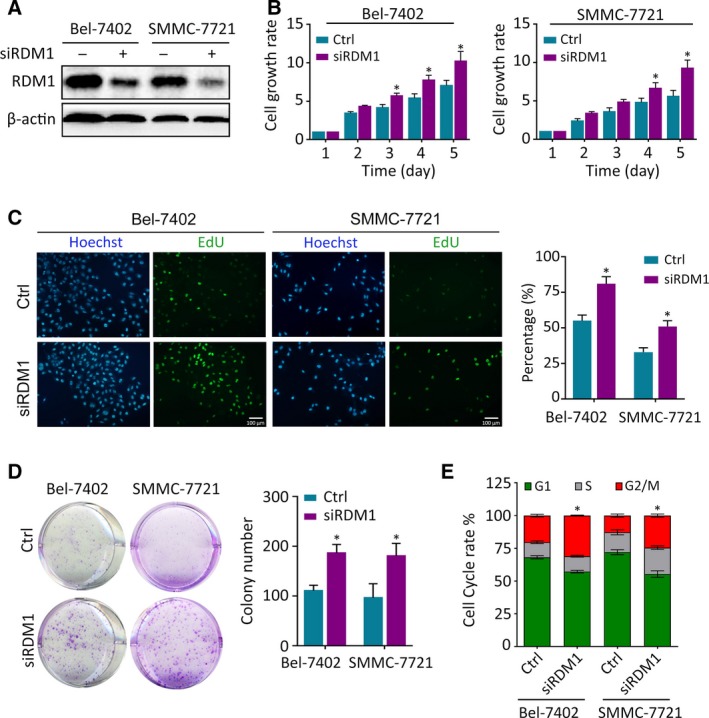
Figure 3.

RDM1‐silencing increased cell proliferation in HCC. (A) RDM1 was silenced using siRNAs in Bel‐7402 and SMMC‐7721 cells. The transfection effect was detected by western blot. (B) Cell proliferation rates were detected by MTT assay in five consecutive days. Fold changes in each day were normalized to the absorbance measured at OD490 record in day 1. (C) EdU assays detected the DNA replication in HCC cells. The positive staining cell proportion was calculated and presented in the right panel. The length of scale bars was 100 μm. (D) Colony formation assays were used to determine the growth of cells in each group. Five hundred cells in each group were seeded into 6‐well plate, and 14 days later, the number of colonies was counted using imagej software. (E) Flow cytometric assays determined the percentage of cells in different phase of cell cycle. All the experiments were done in triplicate. Statistical data were represented as mean ± SD. Student’s t‐test and one‐way ANOVA methods were used to analyze the statistical difference. *P < 0.05.
