Figure 1.

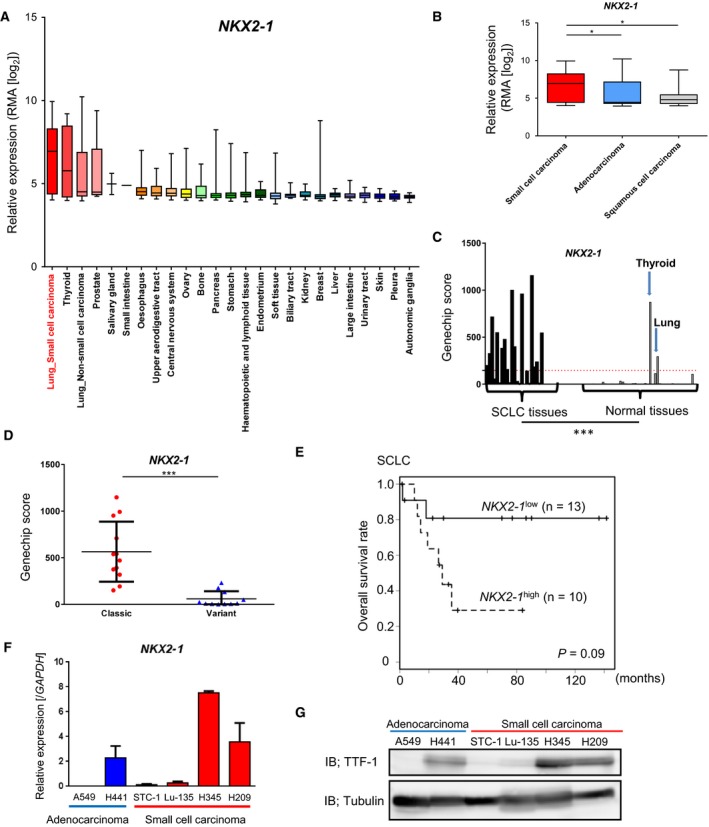
High expression of NKX2‐1 in a subset of SCLC. (A) Expression of NKX2‐1 mRNA (encoding TTF‐1) in various cancers from the CCLE database. Normalized expression of the microarray data was calculated by robust multichip analysis (RMA). (B) Lung cancer cell datasets from CCLE were divided into SCLC (n = 52), LADC (n = 73), and squamous cell carcinoma (n = 28). *P < 0.05, one‐way ANOVA with Dunnett’s test. (C) Expression of NKX2‐1 in 23 clinical SCLC tumors and 42 normal tissues (http://www.ncbi.nlm.nih.gov/geo/query/acc.cgi?acc=GSE43346). Red dotted bar indicates the average expression of NKX2‐1 in the normal tissues. ***P < 0.001, unpaired t‐test. (D) Comparison of NKX2‐1 expression in the clinical SCLC samples (http://www.ncbi.nlm.nih.gov/geo/query/acc.cgi?acc=GSE43346) between the classic (n = 12) and variant (n = 11) subtypes. Bars indicate the mean and S.E. ***P < 0.001, unpaired t‐test. (E) Relationship between NKX2‐1 expression and overall survival in SCLC patients (http://www.ncbi.nlm.nih.gov/geo/query/acc.cgi?acc=GSE43346) (Sato et al., 2013) analyzed by the Kaplan–Meier plot. Patients were divided into NKX2‐1 low (GeneChip score < 250, n = 13) and NKX2‐1 high (score > 250, n = 10). P‐value was calculated by log‐rank test. (F) qRT‐PCR analysis of NKX2‐1 mRNA in lung cancer cells used in this study. Data represent means of the two biological replicates. Error bars, SE. (G) IB for TTF‐1 in the lung cancer cell lines.
