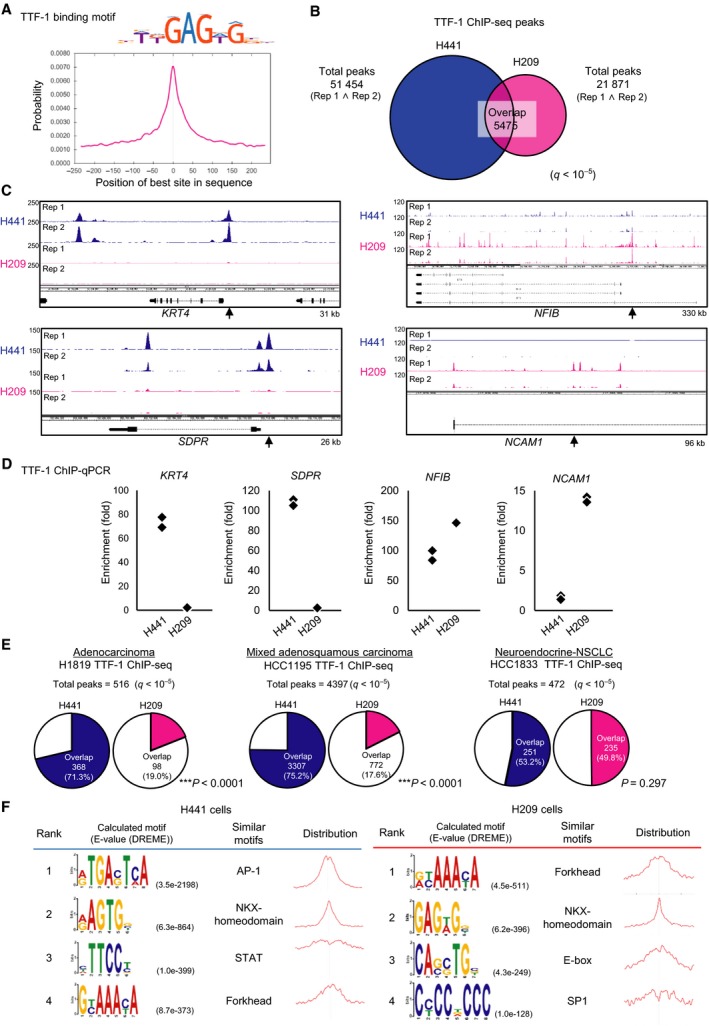
Figure 2.

Distinct properties of TTF‐1 binding regions in SCLC. (A) Motif centrality analysis of TTF‐1 binding regions using CentriMo. The known TTF‐1 binding motif from HOCOMOCOv11 (NKX21_HUMAN.H11MO.0.A, upper panel) was used for calculation. The x‐axis indicates the relative position (bp) of the best site from the peak summit of each binding region. (B) Venn diagram showing the overlap of TTF‐1 ChIP‐seq peaks between H209 and H441. (C) The upper or lower two lanes show TTF‐1 binding signals of the two biological replicates (Rep 1 and Rep 2) obtained from H441 (blue) or H209 (magenta) cells, respectively. Arrows show the position of ChIP‐qPCR analysis evaluated in (D). kb Sizes denote the ranges shown in the panels. (D) ChIP‐qPCR analysis of TTF‐1 binding in H441 and H209 cells. Data represent the result of two biological replicates. %input values at the target genomic loci were normalized to those at HBB locus. (E) Charts showing the proportion of overlaps with TTF‐1 binding regions in NSCLC cell lines. The binding regions of TTF‐1 were identified by ChIP‐seq data using H441 and H209 cells (this study) or other NSCLC cell lines (SRP045118). The proportions of overlaps with the TTF‐1 binding regions in H441 and H209 cells were compared. ***P < 0.0001, chi‐square test. (F) Motif enrichment and centrality analysis using DREME and CentriMo. The top four de novo‐calculated motifs with the smallest E‐values identified by DREME are shown.
