
Figure 3.
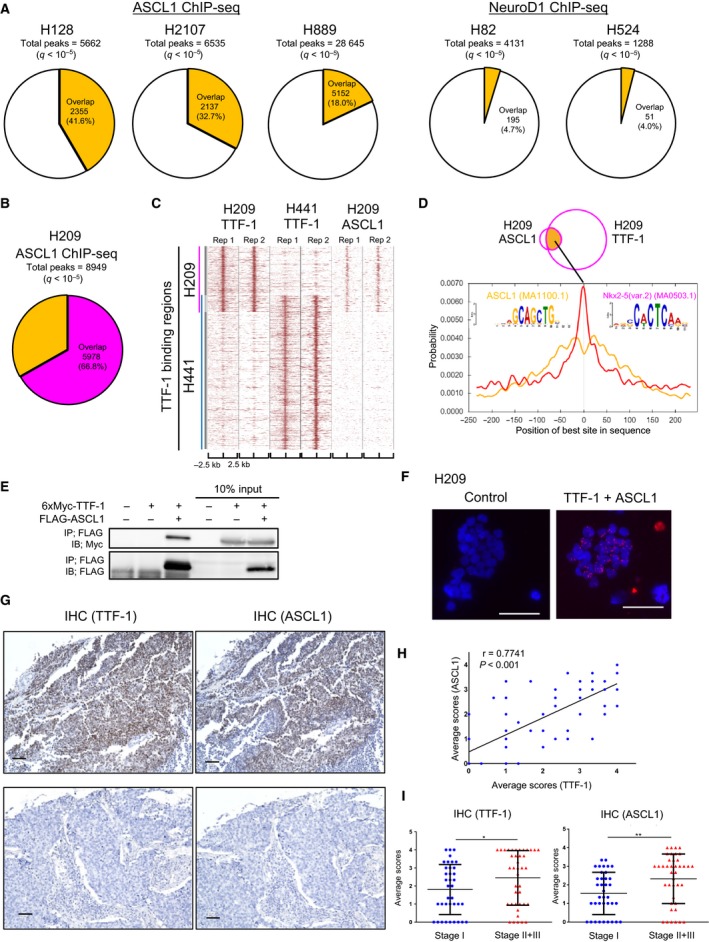
Interaction between TTF‐1 and ASCL1 proteins in SCLC. (A) Charts showing the overlaps with TTF‐1 binding regions in ASCL1 or NEUROD1 binding regions. The binding regions of ASCL1/NEUROD1 were identified by ChIP‐seq data of SCLC cell lines (http://www.ncbi.nlm.nih.gov/geo/query/acc.cgi?acc=GSE69398). (B) A chart showing the overlaps with TTF‐1 binding regions in ASCL1 binding regions in H209 cells. (C) A heat map representation of TTF‐1 and ASCL1 binding regions (two biological replicates, Rep 1 and Rep 2) in H441 and H209 cells. The vertical blue or magenta line indicates the TTF‐1 binding regions in H441 or H209 cells, respectively. (D) Motif centrality analysis using CentriMo in the overlapping regions between TTF‐1 and ASCL1 ChIP‐seq peaks. The 500‐bp sequences flanking the summit position of each TTF‐1 or ASCL1 binding region were used for the analysis. The known NKX‐homeodomain binding motif (Nkx2‐5, MA0503.1) and ASCL1 binding motif (ASCL1, MA1100.1) were used for calculation. The x‐axis indicates the relative position (bp) of the best site from the peak summit of each binding region. (E) Co‐IP assay of HEK293T cells transfected with expression plasmids for 6xMyc‐TTF‐1 and FLAG‐ASCL1. (F) In situ PLA using TTF‐1 and ASCL1 antibodies in H209 cells to show their proximity in the nucleus. H209 cells treated only with the TTF‐1 antibody were used as a control. Proximity between TTF‐1 and ASCL1 was detected as signals (red) in the nuclei (DAPI, blue). Scale bars, 50 µm. (G) Anti‐TTF‐1 and ASCL1 IHC on a tissue microarray of SCLC. The fraction of stained cancer cells was scored as shown in Fig. S4A. Representative images of TTF‐1‐ and ASCL1‐positive (upper panels, score 4) and negative (lower panels, score 0) tumors are shown. Scale bars, 50 µm. (H) Correlations of TTF‐1 and ASCL1 IHC staining scores in the SCLC tissue microarray. r, Spearman’s correlation coefficients. (I) Scatter plots of TTF‐1 (left) and ASCL1 (right) staining scores in a SCLC tissue microarray divided into two groups according to the SCLC stage. Data are represented as mean ± SE (*P < 0.05, **P < 0.01, Mann–Whitney U‐test).