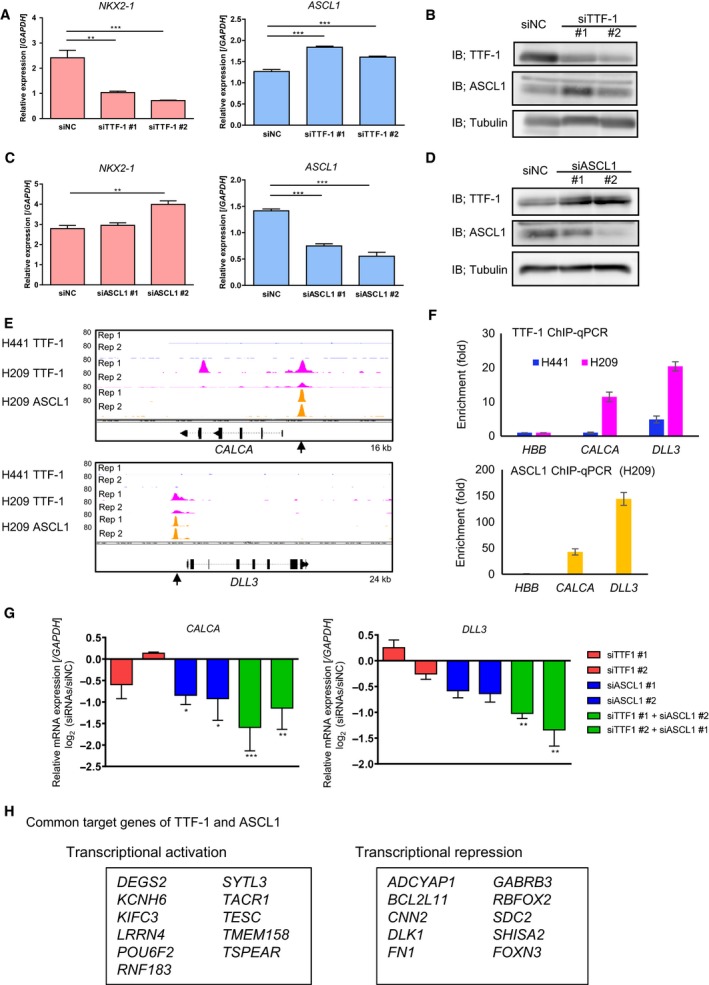
Figure 4.

Cooperative regulation of the expression of target genes by TTF‐1 and ASCL1 in SCLC. (A) Expression of NKX2‐1 (encoding TTF‐1; left) or ASCL1 (right) mRNA in H209 cells treated with negative control (siNC) or TTF‐1 siRNAs (siTTF‐1) by qRT‐PCR. (B) IB for TTF‐1 and ASCL1 in H209 cells treated with siNC or siTTF‐1. (C) Expression of NKX2‐1 and ASCL1 mRNAs in H209 cells treated with siNC and ASCL1 siRNAs (siASCL1). (D) IB for TTF‐1 and ASCL1 in H209 cells treated with siNC or siASCL1. (E) Visualization of the TTF‐1 and ASCL1 ChIP‐seq data at the CALCA and DLL3 gene loci. The upper two lanes show TTF‐1 binding signals in H441 cells. The middle or lower two lanes show TTF‐1 or ASCL1 binding signals in H209 cells, respectively. Rep 1 and Rep 2 indicate biological replicates 1 and 2. The kb sizes denote the ranges shown in the panels. Arrows show the position of ChIP‐qPCR analysis evaluated in (F). (F) ChIP‐qPCR analysis of TTF‐1 and ASCL1 at the genomic regions shown in (E). %input values at the target regions were normalized to those in HBB locus. (G) Fold change in the expression of CALCA and DLL3 mRNA in H209 cells treated with siTTF‐1, siASCL1, or both, relative to those treated with siNC. Expression of mRNAs was quantified by qRT‐PCR. (H) Genes down‐ or upregulated by both TTF‐1 and ASCL1 in H209 cells. The genes with overlapping peaks between TTF‐1 and ASCL1 ChIP‐seq data were selected from the commonly regulated genes of TTF‐1 and ASCL1 determined by RNA‐seq of TTF‐1‐ or ASCL1‐depleted cells. These genes are listed in the boxes. qRT‐PCR data represented as mean ± SE of the three independent experiments. **P < 0.01, ***P < 0.001, one‐way ANOVA with Dunnett’s test.
