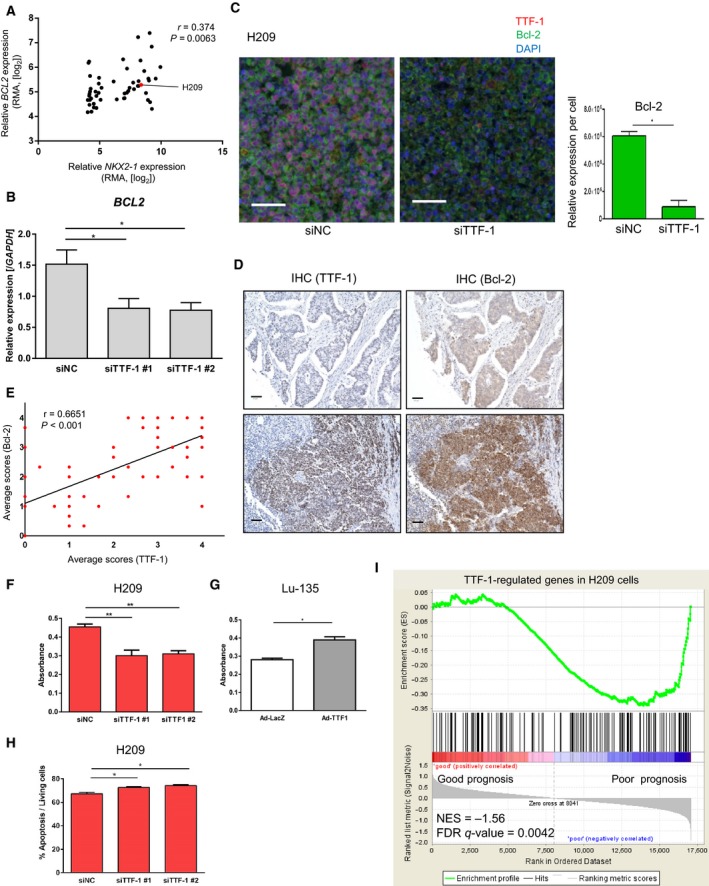
Figure 5.

Regulation of cell growth and BCL2 by TTF‐1 in SCLC. (A) Correlations of NKX2‐1 and BCL2 gene expressions in SCLC cells of the CCLE database. r, Spearman’s correlation coefficients. (B) Relative expression of BCL2 mRNA in H209 cells treated with siTTF‐1 relative to those treated with siNC. (C) Immunofluorescence staining for TTF‐1 (red) and Bcl‐2 (green) in H209 cells treated with siNC (left) or siTTF‐1 #2 (right). Right panel shows the result of quantification of the Bcl‐2 expression. Data represented as mean ± S.E of randomly selected two microscopic fields. *P < 0.05, unpaired t‐test. Scale bars, 50 µm. (D) Anti‐TTF‐1 (left) and Bcl‐2 (right) IHC on a tissue microarray of SCLC. The intensity of staining was scored as shown in Fig. S4B. Representative images are shown. Scale bars, 50 µm. (E) Correlations of TTF‐1 and Bcl‐2 staining scores in the SCLC tissue microarray. r, Spearman’s correlation coefficients. (F) WST‐8 cell proliferation assay in H209 cells treated with siNC or siTTF‐1. (G) WST‐8 cell proliferation assay in Lu‐135 cells infected with adenovirus for LacZ (Ad‐LacZ) and TTF‐1 (Ad‐TTF1) expression. *P < 0.05, unpaired t‐test. (H) Induction of apoptosis by knockdown of TTF‐1 in H209 cells. Annexin V‐positive cells were evaluated by flow cytometry. *P < 0.05, one‐way ANOVA with Dunnett’s test. (I) Enrichment plot of the TTF‐1‐regulated gene set (fold‐changes ≤ 0.66) in H209 cells. GSEA was performed using the gene expression data of the clinical SCLC samples (http://www.ncbi.nlm.nih.gov/geo/query/acc.cgi?acc=GSE43346). Patients’ samples were divided into good (n = 12) and poor (n = 11) prognosis groups as in Fig. 1D. NES, normalized enrichment score. Data represented as mean ± S.E of the three (B, F, H) or two (G) independent experiments. *P < 0.05, **P < 0.01, one‐way ANOVA with Dunnett’s test.
