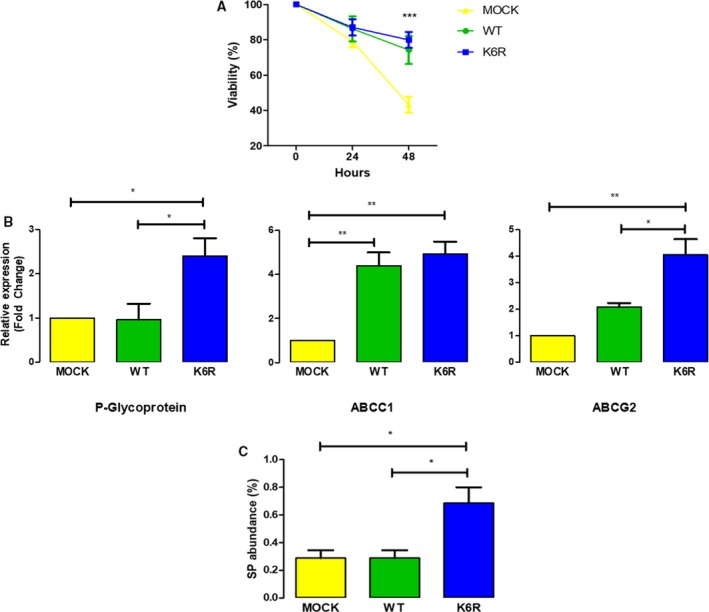
Figure 3.

Stem‐like ECE1cK6R cells display enhanced drug resistance. (A) DLD‐1 cells expressing either Flag‐tagged ECE1cWT or ECE1cK6R proteins (or Mock cells) were analyzed for cell viability using MTS assay following incubation with 25 μm 5‐FU for 48 h. (B) As in A, 106 cells were grown under normal conditions for 48 h and further analyzed for mRNA levels of P‐Glycoprotein, ABCC1, and ABCG2 by RT‐qPCR. (C) As in A, 106 cells were incubated in the presence or absence of 200 μm verapamil for 30 min and incubated with 5 μL DCV for another 30 min. Side population abundance was determined by flow cytometry. Data represent average ± SEM (n = 3). ANOVA and Tukey tests were used. *P ≤ 0.05, **P ≤ 0.01, ***P ≤ 0.001.
