
Figure 4.
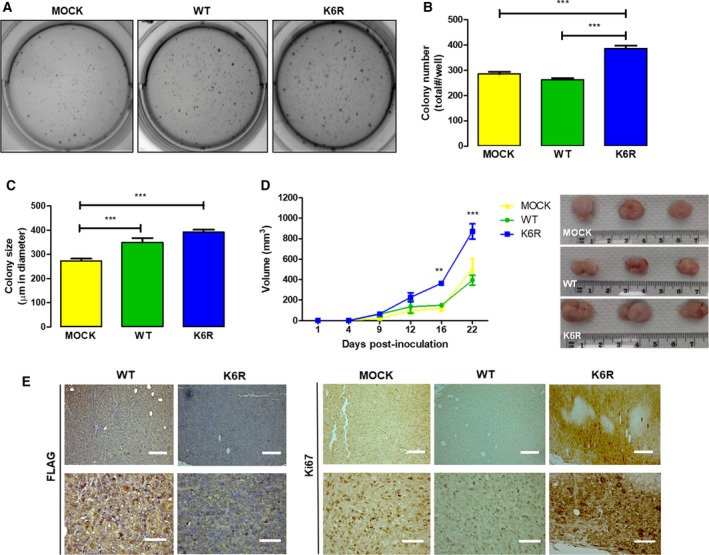
Increased tumor growth of stem‐like ECE1cK6R cells in vivo. (A) DLD‐1 clone cells expressing either Flag‐tagged ECE1cWT or ECE1cK6R proteins (or Mock cells) were grown for 21 days in soft agar, and anchorage‐independent growth was determined. Representative images of crystal violet‐stained colonies obtained at a magnification of 40×. (B) Colonies formed from cells in A were counted and plotted as total colonies/well. (C) Sizes of colonies (μm in diameter) formed in A were measured using micrometrics se premium 4 software. (D) Cells (2 × 10⁶) were subcutaneously injected into NOD/SCID mice, and tumor volume (mm3) was monitored. After the mice were euthanized on day 22, tumors were photographed, measured, and fixed in paraffin. (E) Paraffin slices of tumors from the experiment in D were analyzed by IHC with anti‐FLAG (left) and anti‐Ki‐67 (right) antibodies (scale bars upper panels = 150 µm; lower panels = 50 µm). Data represent average ± SEM (n = 3). ANOVA and Tukey tests were used. **P ≤ 0.01, ***P ≤ 0.001.