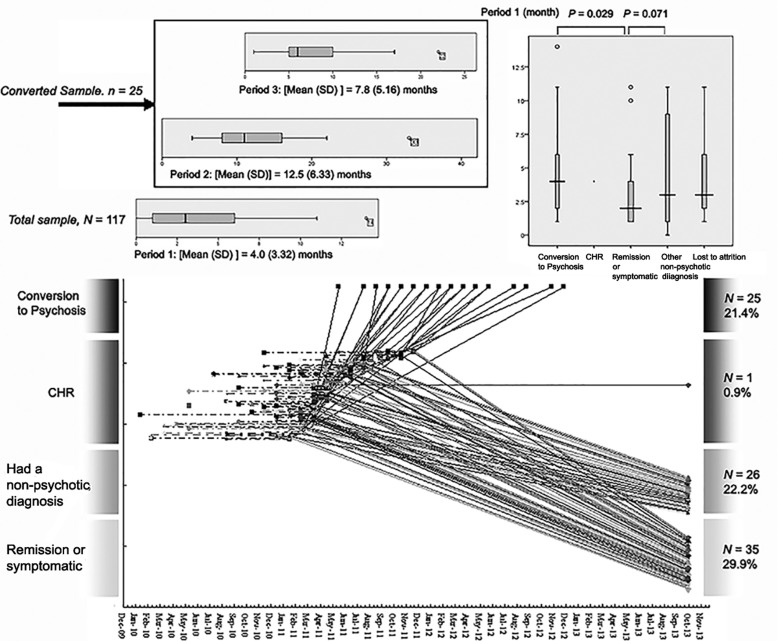
Fig. 2.
Conversion timeline and trajectory plots. Note: The box plot-diagram shows the descriptive statistics over time for those who made a transition to psychosis. Period 1: time between CHR symptom onset and baseline assessment; Period 2: time between CHR symptom onset and conversion; Period 3: time to conversion from the baseline assessment.

