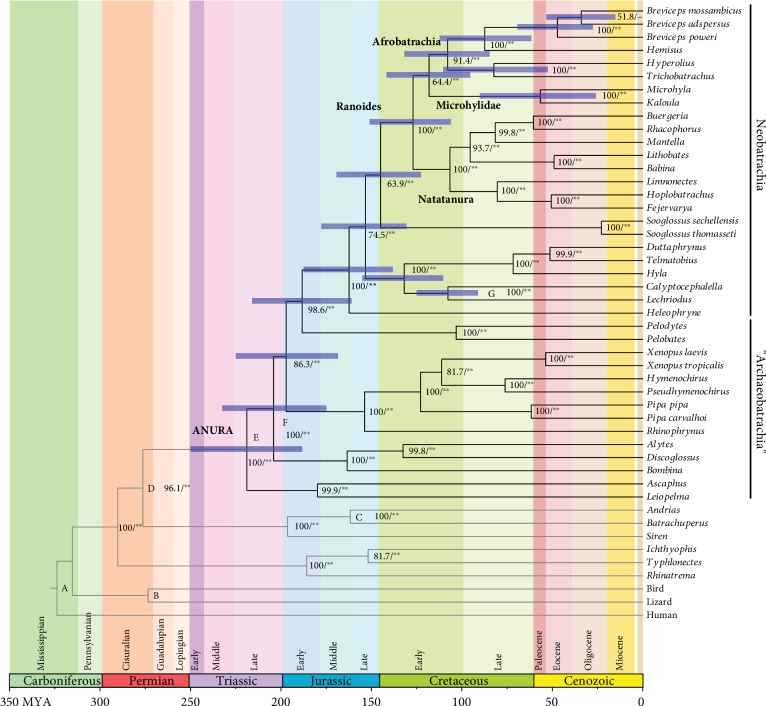
Figure 2.
Time tree of anurans. A phylogenetic tree reflecting the divergence ages estimated using a Bayesian relaxed dating method with the 15,093 bp nucleotide data. The tree topology of amphibians is the same as that of the resultant ML and BI trees. Bold branches indicate the lineages leading to the extant anurans. Horizontal blue bars on each node indicate 95% credibility intervals of estimated divergence age. The bootstrap probability (BP) of ML and Bayesian postprobabilities (BPP) are also shown on the right side of each node (BP value/∗, ∗∗ > 95 and 99 BPPs), and the calibration points used in the dating analysis are indicated on the corresponding nodes (A to G). The scale of the horizontal axis is in million years.

