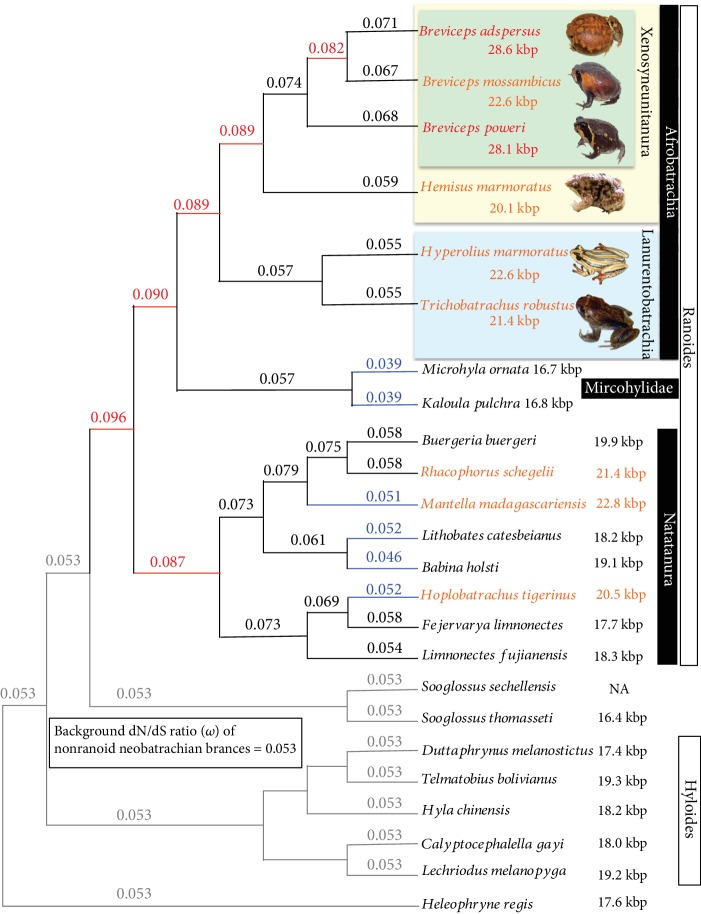
Figure 3.
Changes in the dN/dS ratio (ω) among ranoid lineages. The estimated ω values of neobatrachian branches are shown (based on model 4 in Table 2). The tree topology is the same as those of the ML and BI trees reconstructed in this study. The constant ω (0.053) of nonranoid neobatrachian lineages was regarded as the background value. The estimated ω is shown on each ranoid branch. A high ω indicates the relaxation of purifying pressure. The branches for which ω values are lower (<0.053) and 1.5 times higher (>0.08) than the background are shown in blue and red colors, respectively. The frog taxa having mtDNAs exceeding >20 kbp and 28 kbp are also highlighted by orange and red colors, respectively.

