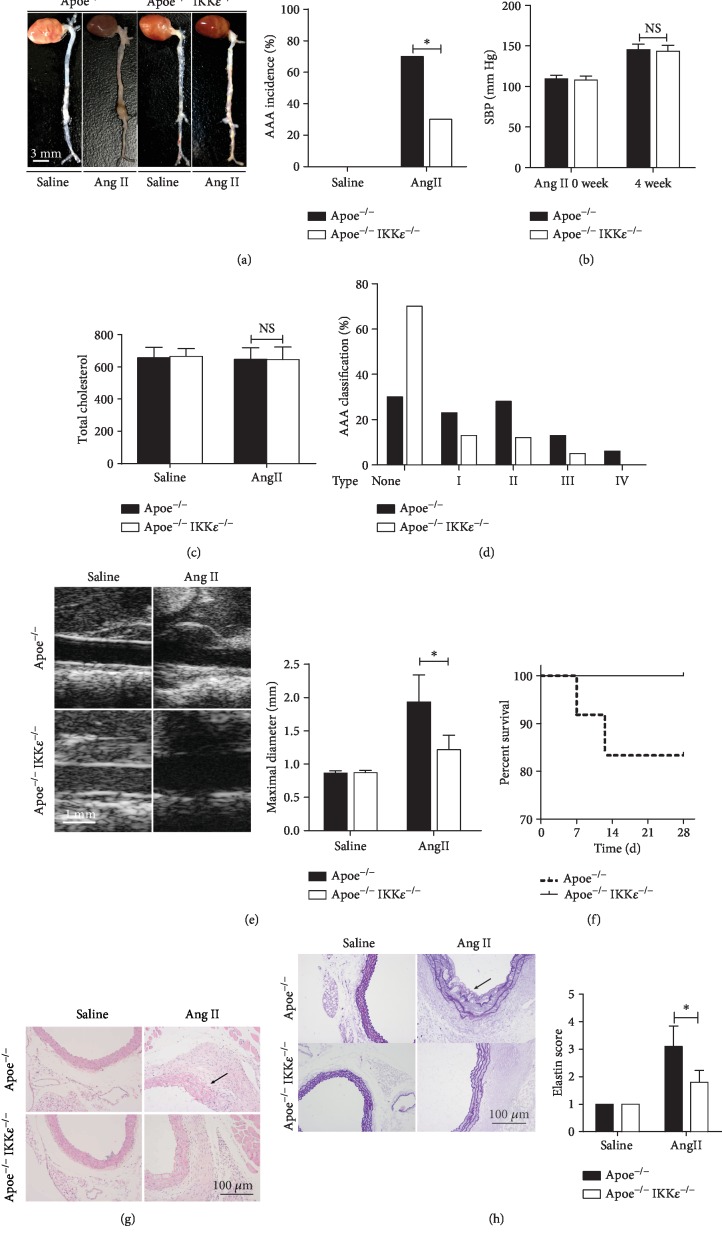
Figure 2.
IKKε deficiency protected from Ang II-induced AAA formation in Apoe−/− mice. (a) Representative images of whole aortas from Apoe−/− versus Apoe−/−IKKε−/− mice were treated with Ang II or saline for 4 weeks. The bar graph shows the incidences of abdominal aortic aneurysm AAA incidence, n = 13‐15, respectively. (b) The systolic blood pressure, n = 5‐6, respectively. (c) The total cholesterol levels from plasma, n = 5‐6, respectively. NS indicates no significance. (d) Classification severity of aortic aneurysm, n = 12‐18 mice per group. ∗P < 0.001 vs. Apoe−/−IKKε−/− mice. (e) Representative images of aortas' ultrasound. The bar graph shows the maximal diameter of the abdominal aorta, n = 13‐15, respectively. (f) Kaplan-Meier survival curve in Apoe−/− versus Apoe−/−IKKε−/− mice following 4 weeks of Ang II infusion. (g) Representative HE staining of the aortic wall in Apoe−/− versus Apoe−/−IKKε−/− mice following 4 weeks of saline or Ang II infusion. (h) Representative EVG staining of the aortic wall in Apoe−/− versus Apoe−/−IKKε−/− mice following 4 weeks of saline or Ang II infusion. Quantification is shown in the right panel, n = 4‐5, respectively.∗P < 0.001 vs. Apoe−/−IKKε−/− mice.

