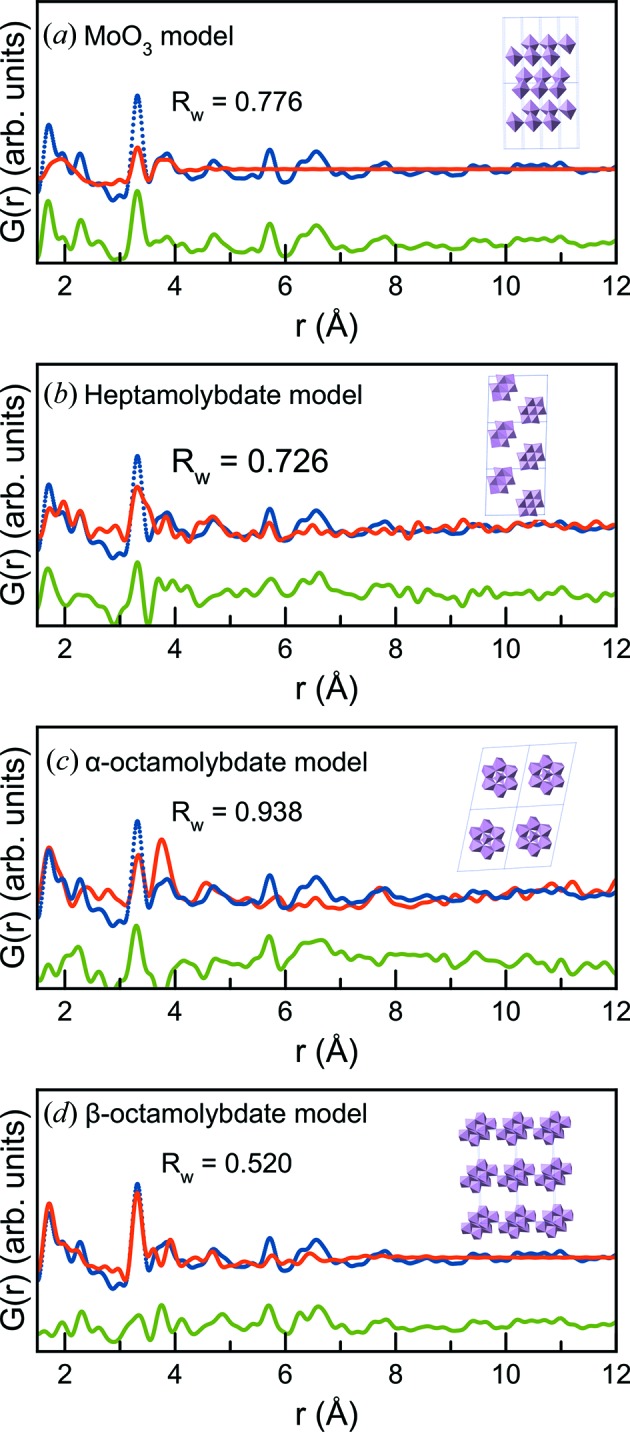
Figure 5.

PDF fits to the data obtained from 15% Mo/γ-Al2O3 data with well-known crystal structures: (a) MoO3, (b) heptamolybdate (NH4)6Mo7O24(H2O)4, (c) α-octamolybdate (C18H20N4)2[Mo8O26] and (d) β-octamolybdate (NH4)6(Mo8O26)(H2O)4. In all fits, the experimental PDF is displayed as blue dots, the calculated model as a red line and the difference curve as a green line.
