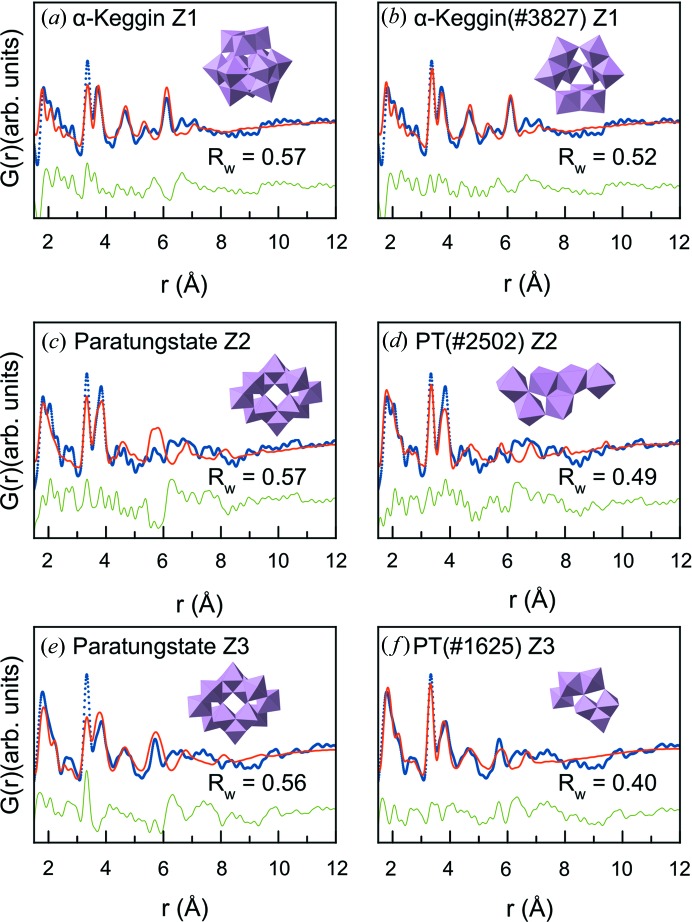
Figure 9.
(a) Fit of the α-Keggin cluster structure to the d-PDF obtained from sample Z1. (b) Fit of the best-fitting α-Keggin-derived cluster structure to the d-PDF obtained from sample Z1. (c) Fit of the paratungstate cluster structure to the d-PDF obtained from sample Z2. (d) Fit of the best-fitting paratungstate-derived cluster structure to sample Z2. (e) Fit of the paratungstate cluster structure to the d-PDF obtained from sample Z3. (f) Fit of the best-fitting paratungstate-derived cluster structure to sample Z3. In all fits, the experimental PDF is displayed as blue dots, the calculated model as a red line and the difference curve as a green line.

