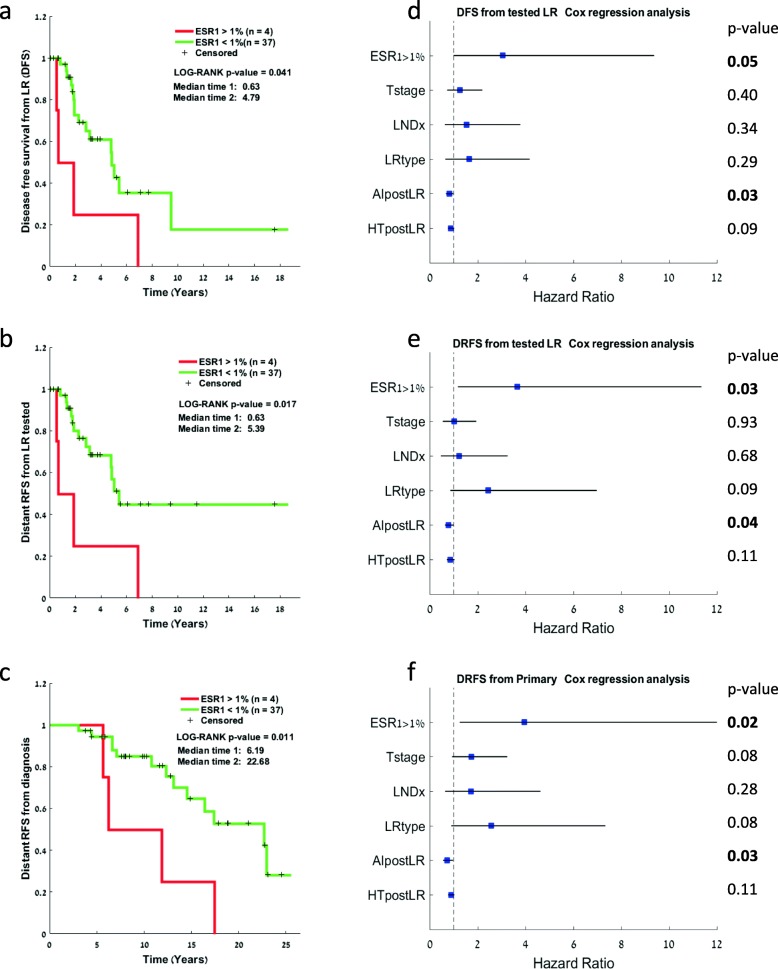
Fig. 3.
Survival analysis for patients with loco-regional recurrence. a Kaplan-Meier plots of distant recurrence-free survival from the primary tumor comparing ESR1 mutations at an allele frequency higher versus lower than 1%. b Kaplan-Meier plots of disease-free survival from the tested local recurrence comparing ESR1 mutations at an allele frequency higher versus lower than 1%. c Kaplan-Meier plots of distant recurrence-free survival from the tested local recurrence comparing ESR1 mutations at an allele frequency higher versus lower than 1%. d–f Univariate Cox regression analysis for the same comparisons as in a–c represented by forest plots showing the hazard ratio for the various clinical parameters. LNDx, lymph node status at diagnosis; LR type, local or regional; error lines represent the 95% confidence interval

