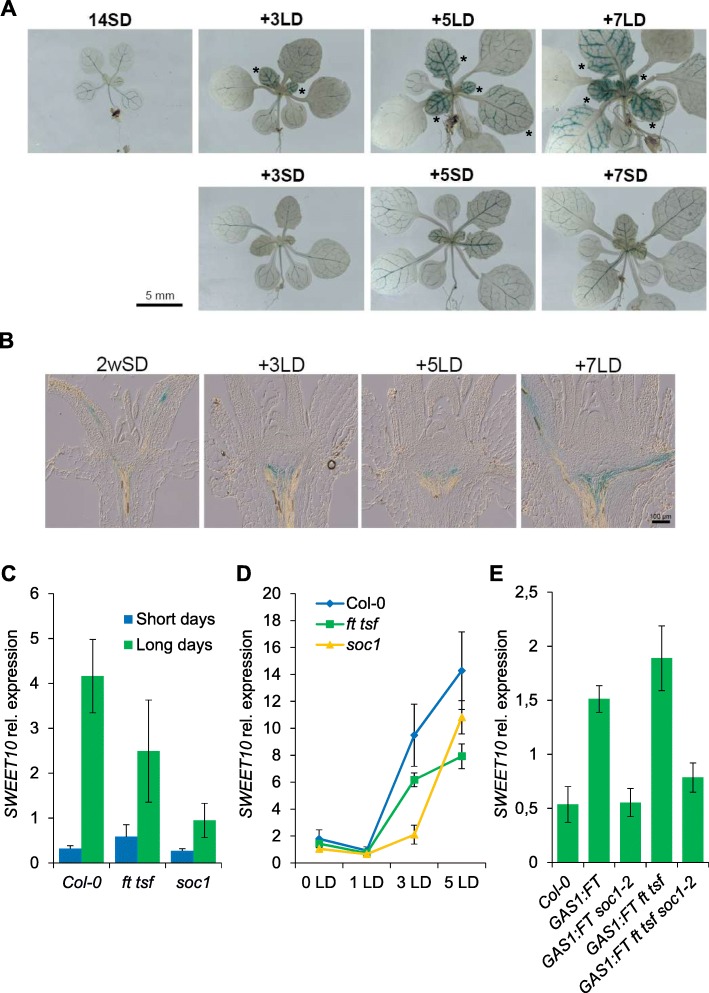
Fig. 2.
Photoperiod signaling pathway contributes to SWEET10 mRNA induction. a and b GUS expression in plants expressing pSWEET10:GUS (line #7, T4 generation) grown under SDs for 2 weeks, shifted to LDs and collected for GUS staining at ZT8 after exposure to different numbers of long days. a Whole seedlings. Scale bar = 5 mm. Asterisks indicate young leaves. b Shoot apices were dissected and visualized under an optical microscope (× 20). Bar scale: 100 μm. c, d and e shows the expression levels of SWEET10 mRNA in shoot apices of different genotypes at ZT8. In (c), plants were grown under LDs and SDs. In (d), plants were grown under SDs for 2 weeks, shifted to LDs shoot apices were harvested at ZT8 in different days. In (e), plants were grown under LDs and shoot apices sampled at ZT8. Errors bars in c, d and e indicate Standard Deviation

