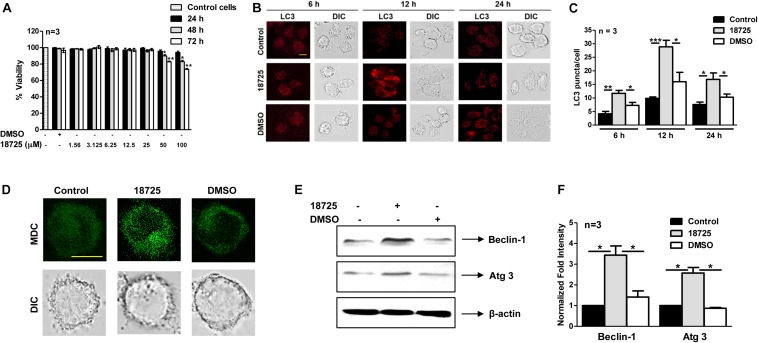
FIGURE 5.
The effect of NSC 18725 pre-treatment on cell viability and autophagy induction in THP-1 cells. (A) THP-1 cells were treated with different concentrations of NSC 18725, and cell viability was determined through WST-1 assay. The data shown on y-axis is percentage cell viability obtained from control and drug-treated macrophages. (B) THP-1 cells were treated with either 25 μM NSC 18725 or DMSO for 6, 12, and 24 h. At designated time points, macrophages were fixed, stained with anti-LC3 antibody, and immunofluorescent images were captured using a confocal microscope. The images shown are representative of three independent experiments. Scale bar given is 10 μM. (C) The LC3 puncta formation in images shown in panel (B) were counted in a random manner (n = 50). The data shown on y-axis is mean ±SE of puncta formation/cell obtained from three independent experiments. (D) THP-1 cells were pre-treated with either 25 μM NSC 18725 or DMSO for 12 h. Subsequently, MDC staining was performed and images of fixed cells were acquired under a confocal microscope. Images given are the representation of the experiment performed in duplicates. Scale bar given is 10 μM. (E) THP-1 cells were pre-incubated with NSC 18725 (25 μM) for 12 h followed by whole cell lysate preparation. The expression of Beclin-1 and Atg 3 in various samples was analyzed through immunoblotting using specific antibodies. The immunoblots shown are representative of three independent experiments. (F) This panel depicts the quantification of the fold change in the expression of Beclin-1 and Atg-3 in NSC 18725 pre-treated samples in comparison to control macrophages for the blots shown in panel (E). The data is shown as mean ± SE of fold change in expression obtained from three independent experiments. P < 0.001, P < 0.01, P < 0.05 are represented as ***, **, and *, respectively.

