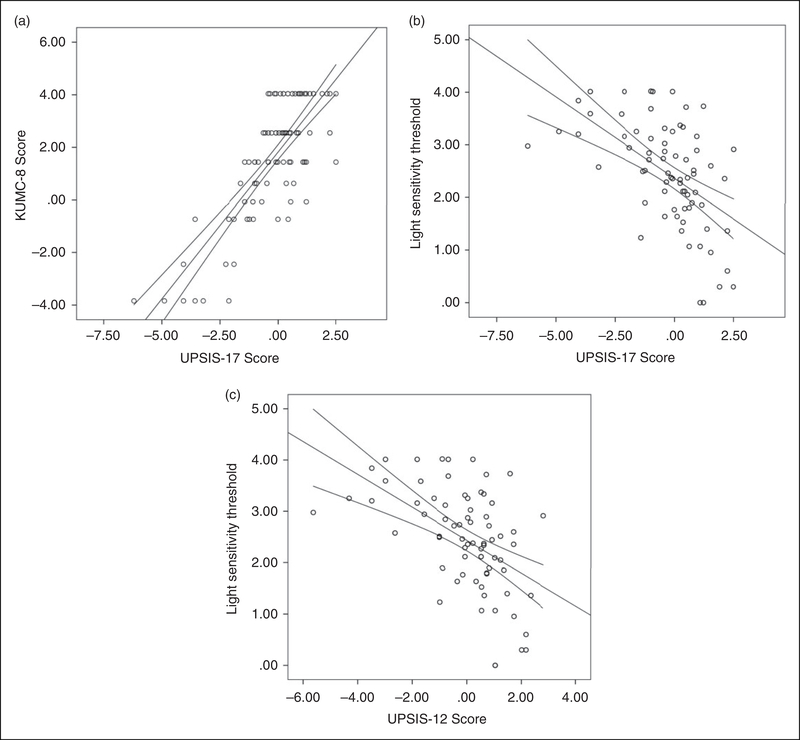
Figure 1.
Scatter plots of questionnaire scores and light sensitivity thresholds. Following logistic transformation, Spearman’s correlation show that high UPSIS-17 scores significantly correlate with high KUMC8 scores (a: UPSIS-17 r = 0.72, p < 0.0001) and low light sensitivity thresholds (b: r = −0.42, p < 0.0001). Similarly, UPSIS-12 scores (the shortened version), also significantly correlate with KUMC8 scores (not shown; r = 0.56, p < 0.0001) and low light sensitivity thresholds (c: r = −0.51, p < 0.0001).

