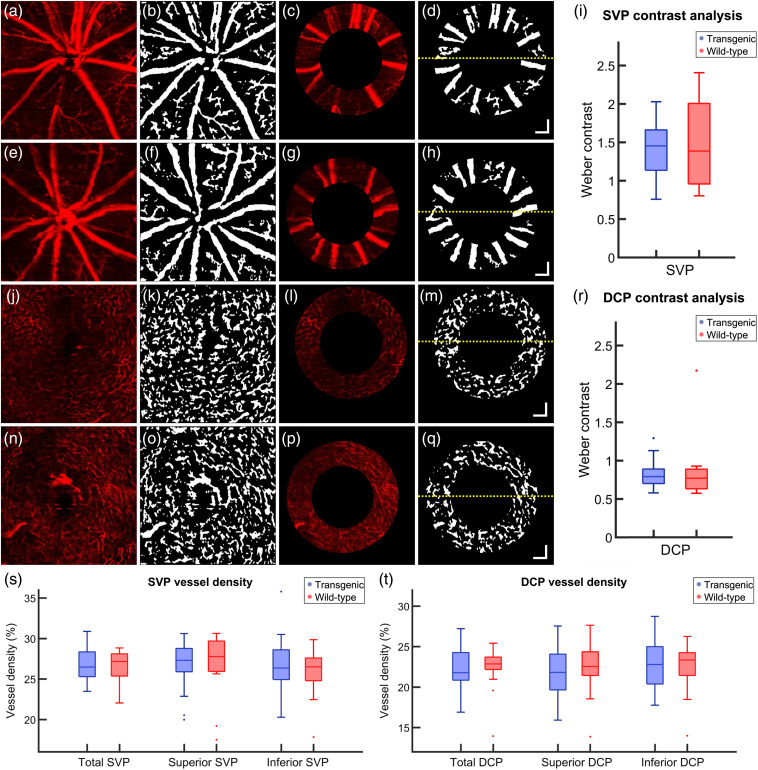
Fig. 6.
(a)–(h) Example of OCTA analysis of the SVP of a (a)–(d) transgenic mouse and (e)–(h) a wild-type control. (a), (e) En face OCTA depth projection through the SVP. (b), (f) Binary representation of the SVP with white pixels corresponding to blood vessels. (c), (g) Annulus around the ONH as provided by the intensity-based contrast data. (d), (h) Binarized annulus, where the yellow dashed line corresponds to the boundary between the superior retina (above) and the inferior retina (below). (i) Weber contrast comparing the intensity of the angiogram signal of the blood vessels to the intensity of the background in the SVP. (j)–(q) Example OCTA analysis of the DCP of a (j)–(m) transgenic mouse and a (n)–(q) wild-type control. (j), (n) En face OCTA depth projection through the DCP. (k), (o) Binary representation of the DCP with white pixels corresponding to blood vessels. (l), (p) Annulus around the ONH as provided by the intensity-based contrast data. (m), (q) Binarized annulus, where the yellow dashed line corresponds to the boundary between the superior retina (above) and the inferior retina (below). (r) Weber contrast comparing the intensity of the angiogram signal of the blood vessels to the intensity of the background in the DCP. (s)–(t) Vessel density analysis. Total, superior, and inferior vessel density calculated for transgenic and wild-type mice in the (s) SVP and the (t) DCP. Age (a)–(d), (j)–(m): 93 weeks, age (e)–(h), (n)–(q): 76 weeks. Single points in (r)–(t) correspond to data outliers. All .

