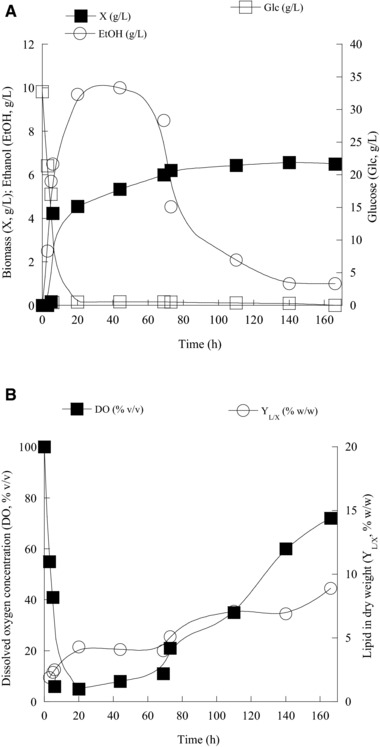
Figure 1.

(A) Kinetics of biomass (X, g/L), ethanol (EtOH, g/L), glucose (Glc, g/L) and (B) intra‐cellular lipids produced per unit of dry weight (YL/X, % w/w) and dissolved oxygen (DO, % v/v) of Candida oleophila NRRL Y‐1613 during growth on glucose, at initial glucose concentration (Glc0) of c. 30 g/L, under nitrogen‐limited conditions. Each point is the mean value of two independent measurements (SE<10%).
