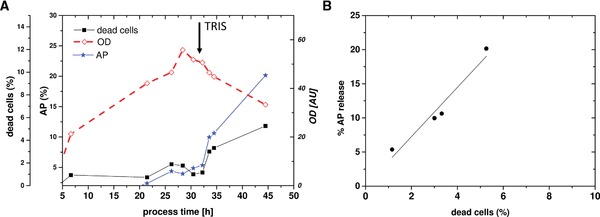
Figure 2.

Cultivation 1 for permeabilization of the OM by the addition of 350 mM TRIS: (A) optical density at 600 nm (OD), extracellular AP activity and ratio of dead cells monitored by FCM; (B) scatter plot showing dead cells (x‐axis) versus periplasmic leakiness (AP release, y‐axis).
