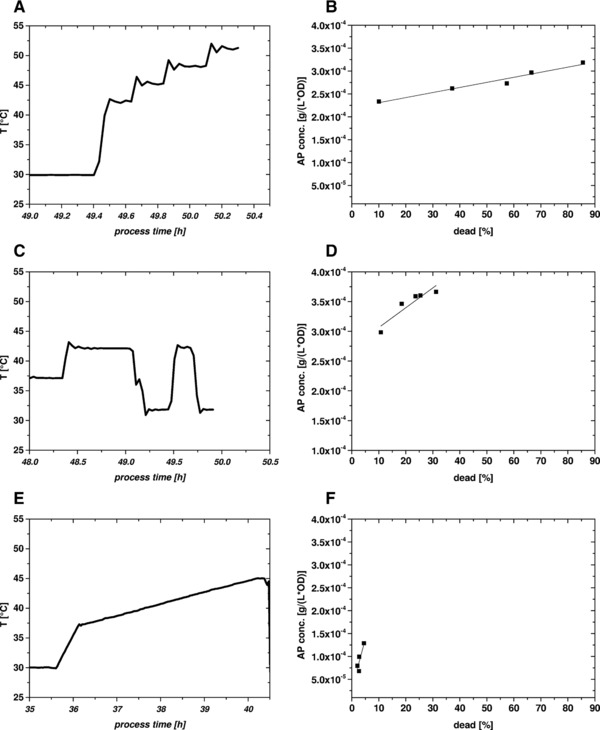
Figure 3.

Cultivations 2–4 for permeabilization of the OM by heat treatment; left side: temperature profiles: (A) cultivation 2, stepwise increase (42–51°C); (C) cultivation 3, oscillating temperatures (32–41°C); (E) cultivation 4, ramp (30–42°C); right side: scatter plot showing dead cells (x‐axis) versus periplasmic leakiness (AP release, y‐axis); (B) cultivation 2; (D) cultivation 3; and (E) cultivation 4. As in cultivations 2 and 3 lysis was very pronounced, the samples of these cultivations were not homogenized. Therefore, AP values are not given in (%) but as normalized values in [g/(L⋅OD)].
