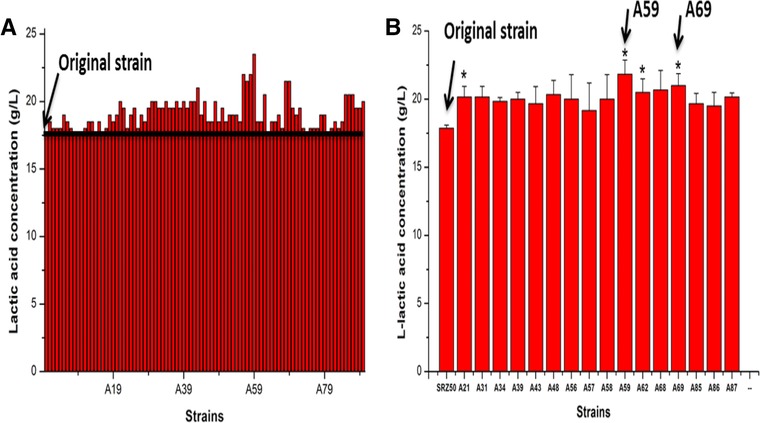
Figure 3.

(A) The first round mutation screening l‐lactic acid high‐production mutants based on 24‐deep MTPs. (B) The second round screening based on 24‐deep MTPs. The error bars in the figure indicate the standard deviations of three parallel replicates, and p < 0.05 indicated a significant difference and p < 0.01 indicated a highly significant difference.
