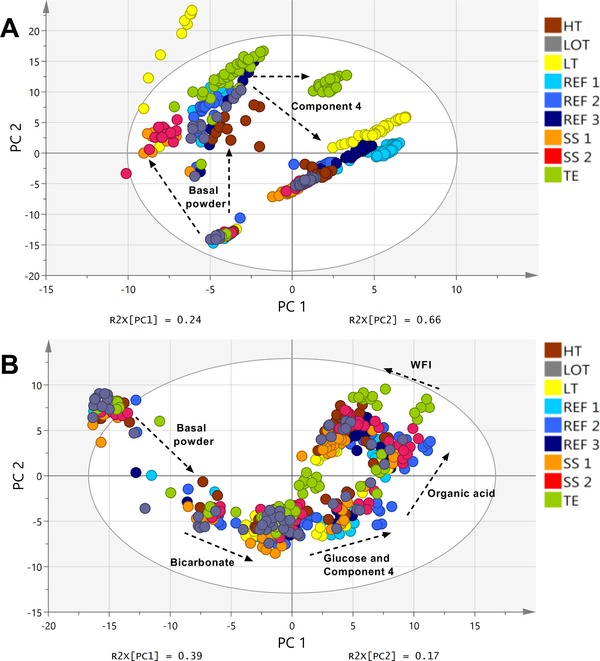
Figure 2.

(A) PLS model with principal component 1 (PC 1) and principal component 2 (PC 2) (R 2X: 0.90; R 2Y:0.47; Q 2: 0.27) derived from the 2D FL data over time of all P‐media batches. The addition of basal powder and Component 4 led to strong changes in the 2D FL signal during the preparation. (B) PLS model with principal component 1 (PC 1) and principal component 2 (PC 2) (R 2X: 0.56; R 2Y:0.83; Q 2: 0.72) derived from the MIR data over time of all P‐media batches. Data were preprocessed via Savitzky‐Golay (SG) and 2nd derivative. Changes in the MIR profile could be detected mainly after addition of basal powder, bicarbonate, glucose, Component 4, organic acid, and water for injection (WFI). A detailed description of the Figure legend is presented in Table 2. Q 2, goodness of prediction; R 2, goodness of fit
