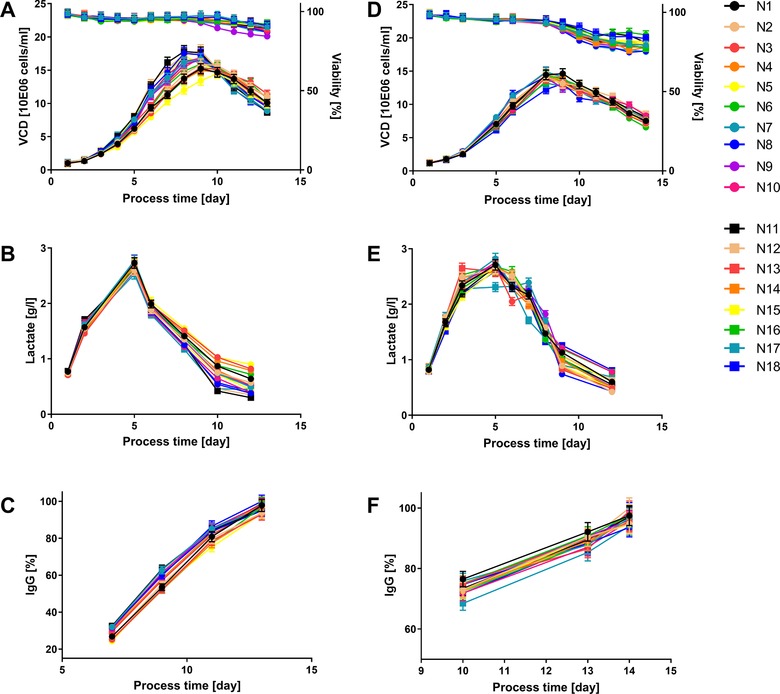
Figure 5.

Fed‐batch process performance of cell line A with variable P‐media (A, B, C) and F‐media (D, E, F) out of the design of experiment. The legend corresponds to the media batch number out of Table 1. The error bars represent the technical measurement error of the analytical devices
