
Figure 6.
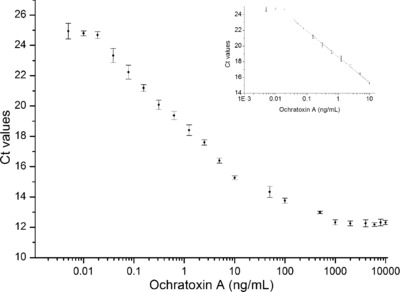
The aptamer‐dissociation from apta‐beads complex in response to OTA addition. The decrease in Ct in response to higher OTA concentrations reflects to the dissociation of aptamer from apta‐beads complex into the supernatant. The assay was able to detect OTA with the linear relationship of Ct values from 0.039–1000 ng/mL, R 2 = 0.95. The LOD of the Apta‐qPCR was found to be 0.009 ng/mL OTA as shown in inset figure.