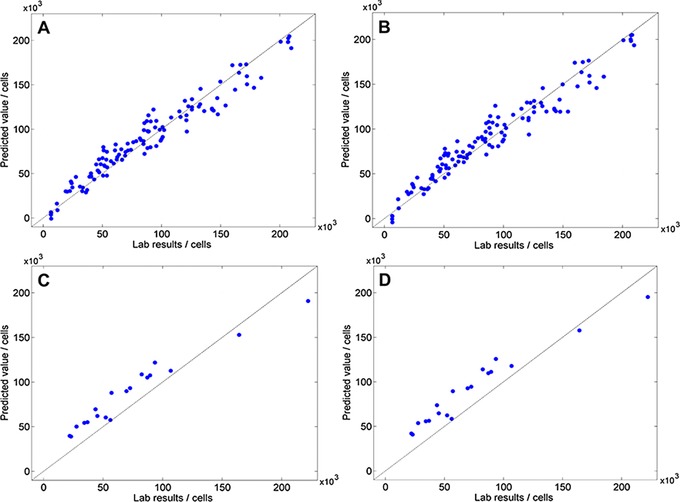
Figure 2.

(A) Scatterplot of predicted value vs. lab results of model 1: R 2 = 93.99; RMSECV = 12 700 cells; RPD = 4.1. (B) Scatterplot of predicted value versus lab results of model 2: R 2 = 93.76; RMSECV = 12 900 cells; RPD = 4.0. (C) Validation of model 1: RMSEP = 19 000 cells. (D) Validation of model 2: RMSEP = 20 900 cells.
