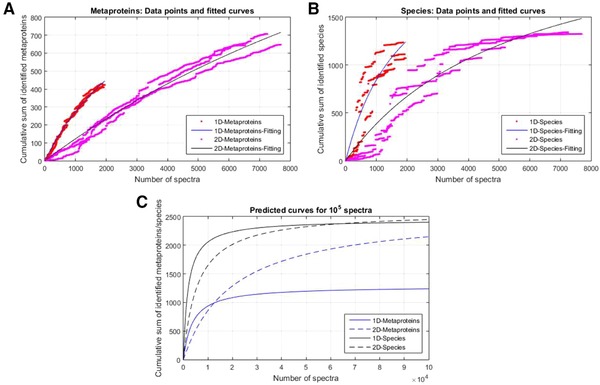
Figure 1.

The rarefaction curves show the cumulative sum of identified metaproteins (A) and species (B) against the number of identified spectra sorted by intensity for sample 1. For each dataset, a curve fitting was carried out using Equation (1) 21. (C) Estimated number of identified metaproteins (blue) and species (black) for 100 000 spectra. The data is based on the calculated parameters a and b from curve fitting.
