
Figure 2.
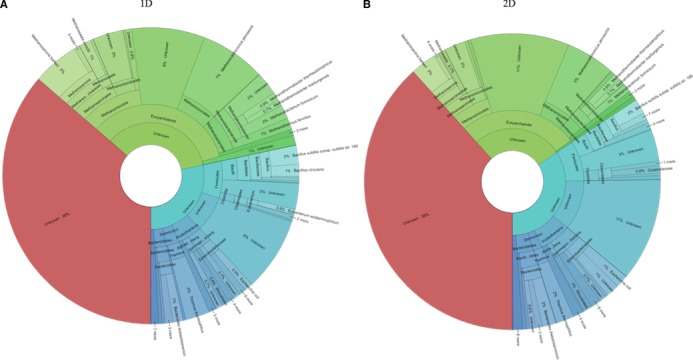
Taxonomic profile of sample 1. (A) Taxonomic profile of 1D prefractionation without Eukaryotes. (B) Taxonomic profile of 2D prefractionation without Eukaryotes. The profile was visualized using Krona tools 23.
Official websites use .gov
A
.gov website belongs to an official
government organization in the United States.
Secure .gov websites use HTTPS
A lock (
) or https:// means you've safely
connected to the .gov website. Share sensitive
information only on official, secure websites.
Taxonomic profile of sample 1. (A) Taxonomic profile of 1D prefractionation without Eukaryotes. (B) Taxonomic profile of 2D prefractionation without Eukaryotes. The profile was visualized using Krona tools 23.