Figure 3.

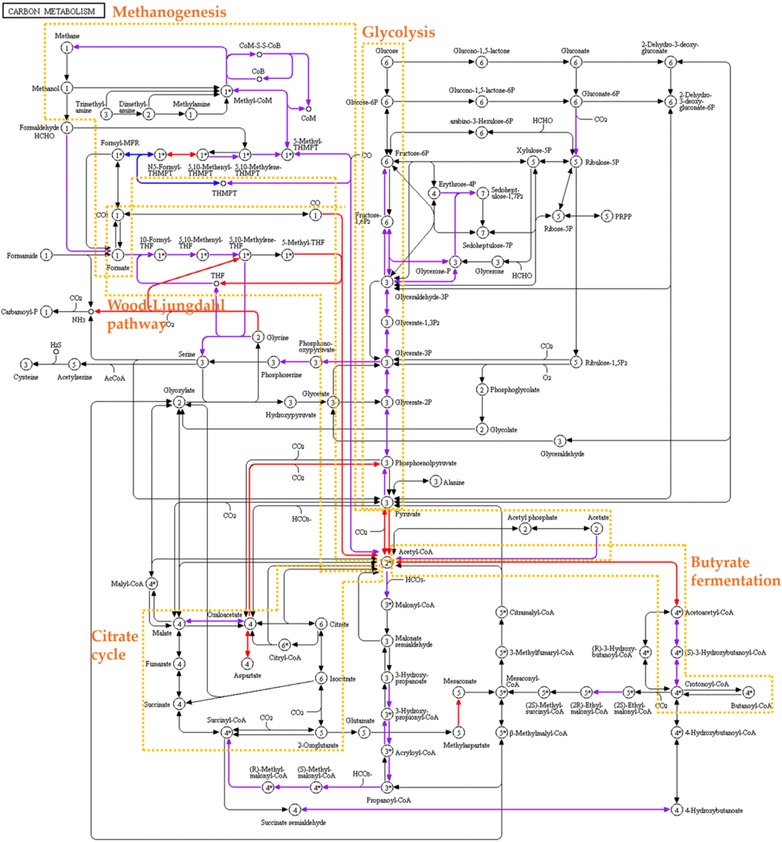
KEGG pathway map of the central carbon metabolism (map 01200) 24 using KEGG Ontologies and Enzyme Commission numbers identified by 1D or 2D of sample 1. Blue: Identified in 1D; Red: Identified in 2D; Purple: Identified in both 1D and 2D.

KEGG pathway map of the central carbon metabolism (map 01200) 24 using KEGG Ontologies and Enzyme Commission numbers identified by 1D or 2D of sample 1. Blue: Identified in 1D; Red: Identified in 2D; Purple: Identified in both 1D and 2D.