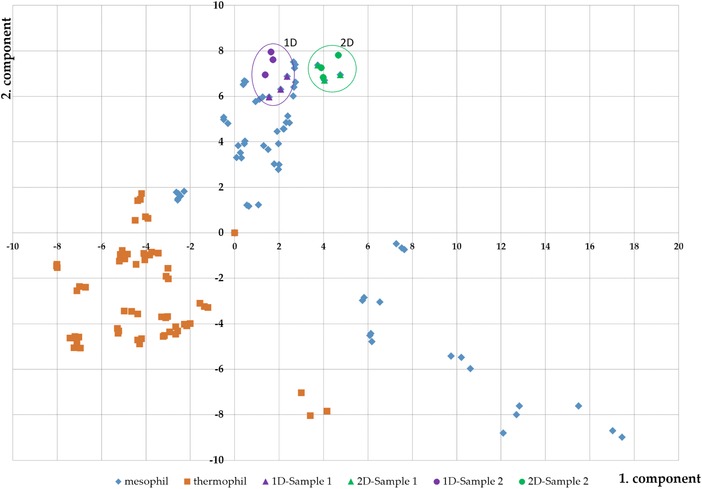
Figure 6.

Principle component analysis is based on all metaproteins, which represent in at least one BGP one percent of the identified spectra. For comparability, the two investigated samples (sampe 1: triangle; sample 2: point) with 1D (purple) and 2D (green) were plotted together with 40 other biogas plant samples 8. The mesophilic BGP were plotted in blue and the thermophilic BGP in orange.
