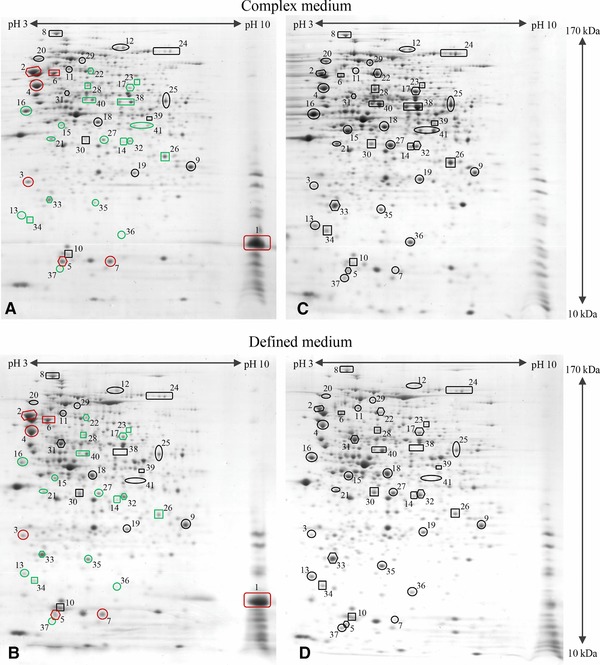
Figure 3.

Proteomic fingerprint of hFGF‐2 producing cells. The proteome of hFGF‐2 producing cells at the end of production in complex (A, 3.5 h postinduction) and defined medium (B, 5 h postinduction) in comparison to nonproducing control cells grown under identical conditions to the same sampling time point in complex (C) and defined medium (D), respectively. Gel images indicating representative proteins are shown: hFGF‐2 1; chaperones, DnaK 2, GrpE 3, GroEL 4, GroES 5, HtpG 6, IbpA 7; transcription, RpoB 8; translation, RpsB 9, RpsF 10, GlyS 11, InfB 12; sugar uptake systems, Crr 13, ManX 14, MalE 15, LamB 16; peptide transport, OppA 17; upper glycolysis, FbaA 18; lower glycolysis, GpmA 19, PpsA 20; pentose phosphate pathway, TalB 21; by‐product assimilation, Acs 22, PoxB 23, AdhE 24; TCA cycle: GltA 25, SucD 26, Mdh 27; anaplerotic reactions, PckA 28, MaeB 29; amino acid biosynthesis, IlvE 30, IlvC 31, CysK 32; removal of ROS, AhpC 33, Tpx 34, SodB 35; DNA protection, Dps 36, UspA 37; amino acid degradation, TnaA 38, AstA 39; metabolite degradation, GatZ 40, GatD, 41. Red and green colors indicate higher or lower levels, respectively, of the corresponding proteins in hFGF‐2 producing than in nonproducing control cells. Gel images indicating all identified proteins and representing other sampling times points (e.g. directly before and 1 h after induction of hFGF‐2 synthesis) are shown in the Supporting Information Figs. S1–S8.
